Energy statistics, July 2023
Released: 2023-10-10
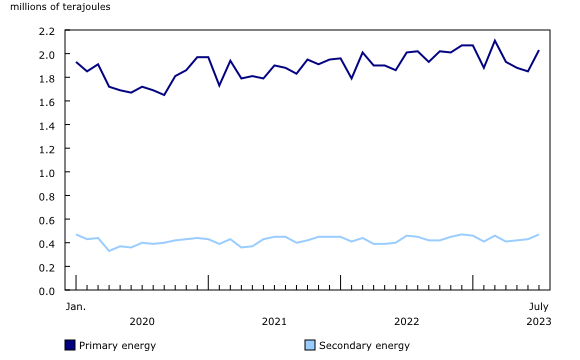
In July 2023, primary energy production rose 1.0%, with a notable gain in natural gas (+2.7%) being partially offset by a loss in primary electricity (-10.9%). Secondary energy posted a gain of 4.1% compared with July 2022.
For more information on energy in Canada, including production, consumption, international trade, and much more, please visit the Canadian Centre for Energy Information portal and follow #energynews on social media.
Amid record high temperatures, consumption and imports of electricity set monthly series highs for July
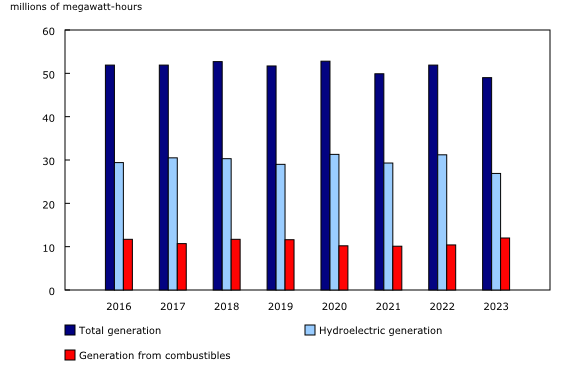
As some parts of Canada experienced very high temperatures in July, the electricity industry recorded several firsts. Electricity exports and hydroelectric generation were the lowest for the month of July since the electricity survey was redesigned as of January 2016. British Columbia, which relies heavily on hydroelectricity, has received the least amount of precipitation to date in 2023 compared with every year since 2016. At the same time, Canada's generation from combustible sources, electricity consumption, and imports were the highest on record for the month of July.
Total electricity generation in Canada declined 5.5% year over year to 49.0 million megawatt-hours (MWh) in July while hydroelectricity fell 13.6%. Quebec (-13.4%) and British Columbia (-30.9%) were the main contributors to the hydroelectric generation decline. In recent months, Quebec has reduced its export levels, citing weather conditions and low prices, which have resulted in decreased generation.
Electricity consumption rose 3.6% year over year to 46.9 million MWh in July, while imports jumped 136.6% to 2.3 million MWh because of British Columbia, which accounted for 89.3% of total imports. By contrast, exports of electricity to the United States fell 42.2%.
Crude inventories at lowest level since December 2019
Production of crude oil and equivalent products rose 1.0% from July 2022 to 24.5 million cubic metres. The increase was driven by production of synthetic crude oil, up 13.3% to 6.6 million cubic metres. With turnarounds completed in the second quarter of 2023, some upgraders posted record production in July.
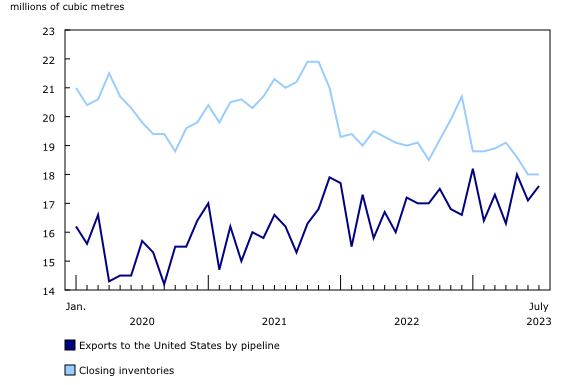
Closing inventories of crude oil declined 5.6% year over year to 18.0 million cubic metres, the 19th consecutive monthly year-over-year decrease. This was the lowest level of inventories since December 2019, prior to the COVID-19 pandemic. This trend was largely attributable to increased exports to the United States by pipeline, which have been rising for over two years. Synthetic crude used as an input to Canadian refineries had also been trending up recently, with July marking the first year-over-year decline in the same 19-month period.
Production of gasoline and renewable fuels up in July
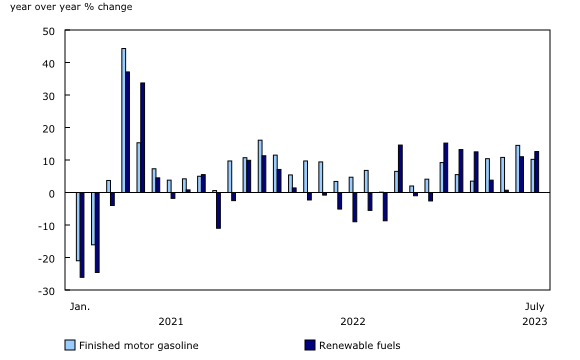
Production of finished petroleum products rose 3.9% year over year in July, driven by motor gasoline which rose 10.2%, following consecutive increases since March 2021.
Production of renewable fuels climbed 12.6% in July to the second-highest production level since the series began in January 2020. Canada's Clean Fuel Regulations came into effect in July 2023.
Production and exports of natural gas up in July
Production of marketable natural gas rose 2.7% year over year in July to 659.9 million gigajoules. This contrasted with May and June production which had notable drops largely attributable to forest fires. Exports of natural gas to the United States climbed 3.0% year over year in July, the first increase after six months of year-over-year declines.
Note to readers
The consolidated energy statistics table (25-10-0079-01) presents monthly data on primary and secondary energy by fuel type (crude oil, natural gas, electricity, coal, etc.) in terajoules, and supply and demand characteristics (production, exports, imports, etc.) for Canada. The table uses data from a variety of survey and administrative sources. Estimates are available starting with the January 2020 reference month. For more information, please consult the Consolidated Energy Statistics Table: User Guide. This release includes revisions from January 2020 to June 2023 and presents new data for July 2023, to reflect updated secondary electricity data.
The survey programs that support the "Energy statistics" release include:
- Crude oil and natural gas (survey number 2198; tables 25-10-0036-01, 25-10-0055-01 and 25-10-0063-01). Data from January 2016 to June 2023 have been revised.
- Energy transportation and storage (survey number 5300, tables 25-10-0075-01 and 25-10-0077-01). Data for June 2023 have been revised.
- Natural gas transmission, storage and distribution (survey numbers 2149, 5210 and 5215; tables 25-10-0057-01, 25-10-0058-01 and 25-10-0059-01). Data from January 2016 to June 2023 have been revised.
- Refined petroleum products (survey number 2150, table 25-10-0081-01).
- Renewable fuel plant statistics (survey number 5294, table 25-10-0082-01). Data from January to June 2023 have been revised.
- Electric power statistics (survey number 2151, tables 25-10-0015-01 and 25-10-0016-01).
- Coal and coke statistics (survey numbers 2147 and 2003, tables 25-10-0045-01 and 25-10-0046-01). Coal data from January to December 2022 have been revised.
Data are subject to revisions. Energy data and other supporting data used in the text are revised on an ongoing basis for each month of the current year to reflect new information provided by respondents and updates to administrative data. Historical revisions are also performed periodically.
Definitions, data sources and methods for each survey program are available under the respective survey number.
The Energy Statistics Program relies on data collected from respondents and administrative sources.
Data in this release are not seasonally adjusted.
Occasionally, data from Environment and Climate Change Canada are referenced by the Energy Statistics Program using Cooling Degree Days (CDDs) as a measure of temperature. CDDs reflect the relationship between outdoor temperatures and the need to cool indoors to maintain room temperature. As temperatures outside rise, the number of CDDs increases.
Contact information
For more information, or to enquire about the concepts, methods or data quality of this release, contact us (toll-free 1-800-263-1136; 514-283-8300; infostats@statcan.gc.ca) or Media Relations (statcan.mediahotline-ligneinfomedias.statcan@statcan.gc.ca).
- Date modified:


