Government finance statistics, second quarter 2023
Released: 2023-09-25
Deficits persist for federal and provincial–territorial governments
The Canadian general government, excluding social security funds (Canada Pension Plan and Quebec Pension Plan), posted a deficit of $5.5 billion, mainly due to federal ($3.8 billion) and provincial–territorial ($1.0 billion) governments.
In the second quarter, the Canadian general government surplus decreased by $3.5 billion year over year. The increase in general government revenue (+5.8%) was offset by higher growth in expenses (+7.4%). The increase in expenses was mostly the result of growth in compensation of employees (+7.2%), social benefits (+8.1%) and interest expenses (+20.4%).
Canadian general government net operating balance as a percentage of nominal gross domestic product (GDP) has remained within the range of -2.0% to +2.0% of GDP for almost two years. In the second quarter of 2023, Canadian general government recorded a surplus of 1.4% of GDP, while the deficit-to-GDP ratio was 0.6% for the federal government and 0.1% for the provincial–territorial governments.
Interest expenses on the rise
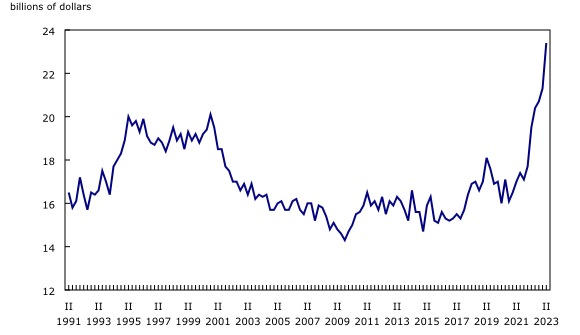
In recent quarters, interest expenses were the fastest growing component among Canadian general government expenses. In the second quarter, interest expenses were up by 20.4% (+$4.0 billion) compared with the same quarter of the previous year.
The federal government, whose debt level is higher than the provincial-territorial governments, recorded a steep increase (+28.5%) in interest expenses year over year in the second quarter, while provincial-territorial government interest expenses grew at a slower pace (+15.2%).
Over three years, federal government interest expenses rose from $5.0 billion to $10.3 billion (+105.6%) due to both higher debt level and a sharp rise in market interest rates.
Net debt-to-GDP ratio continues its downward trend
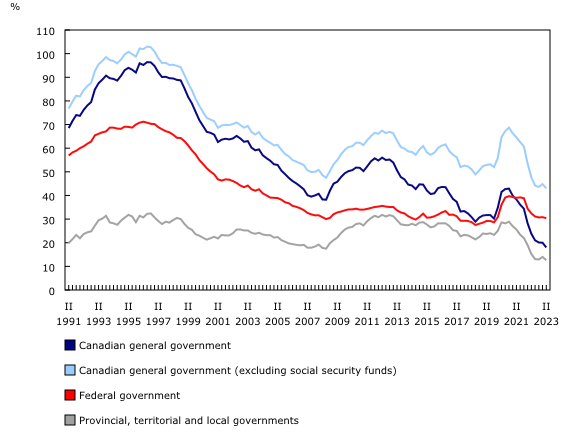
In the second quarter, Canadian general government net debt decreased significantly (-20.4% or -$129.4 billion) year over year and stood at $506.3 billion. Excluding social security funds, the general government net debt decreased by $64.1 billion (-5.1%).
The increase in the value of financial assets (+4.7% or +$127.3 billion) accounted for most of the change in net debt compared with the same quarter in 2022, although the change in the market value of liabilities (-0.1% or -$2.1 billion) also contributed positively. Federal government net debt decreased slightly (-1.3%), while the value of provincial and territorial government net debt was down more significantly (-16.0%).
As a percentage of GDP, Canadian general government net debt continued its downward trend and stood at 18.0% of GDP at the end of the second quarter of 2023. Excluding social security funds, whose assets are earmarked for the payment of future benefits, the net debt-to-GDP ratio was 43.0% in the second quarter, down from 47.6% in the same quarter of the previous year.
Note to readers
Quarterly financial data for the Canadian general government and its subsectors from the first quarter of 1990 to the second quarter of 2023 are now available. These subsectors include the federal government, provincial and territorial governments, local governments and the Canada and Quebec Pension Plans.
Government Finance Statistics (GFS) presents fiscal statistics using the standard developed by the International Monetary Fund. This standard allows consistent aggregation and analysis between participating countries.
In GFS standards, the net operating balance is the difference between revenues and expenses for a given period and is a summary measure of the sustainability of government operations. When revenues are lower than expenses, a deficit is recorded, while the reverse induces a surplus.
The net financial worth is the difference between financial assets and liabilities at market prices for a given period and is a key indicator to assess the sustainability of fiscal policy. This measure is equivalent to the reverse value of net debt, a measure commonly used in government's financial statements.
Currently, GFS quarterly data are derived by mapping Canada's System of National Accounts data to GFS standards and conventions.
This release of GFS includes revised data for the first quarter of 2023.
Next release
Data on the Canadian government finance statistics for the third quarter of 2023 will be released on January 9, 2024.
Products
Additional information can be found in the Latest Developments in the Canadian Economic Accounts (13-605-X). The User Guide: Canadian System of Macroeconomic Accounts (13-606-G) is also available. This publication has been updated with Chapter 9. Government Finance Statistics.
Contact information
For more information, or to enquire about the concepts, methods or data quality of this release, contact us (toll-free 1-800-263-1136; 514-283-8300; infostats@statcan.gc.ca) or Media Relations (statcan.mediahotline-ligneinfomedias.statcan@statcan.gc.ca).
- Date modified:


