Urban public transit, March 2023
Released: 2023-05-18
Highlights
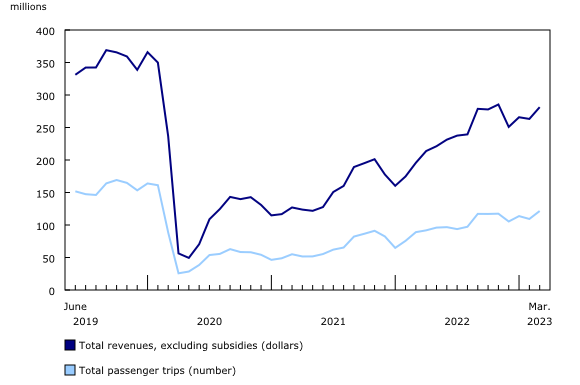
In March 2023, urban transit ridership reached 121.5 million trips, the highest monthly number of passengers carried since before the COVID-19 pandemic.
With more riders returning to public transit, passenger volumes in March recovered to almost three-quarters (73.8%) of the pre-pandemic level from March 2019.
More people riding transit
Canada's urban transit networks recorded an estimated 121.5 million rides in March 2023, an increase of 36.5% (+32.5 million trips) from March 2022, marking 24 straight months of year-over-year increases.
With employment edging up coupled with elevated gas prices, ridership in March recovered to its highest monthly total since the pandemic started, with the number of passenger trips reaching 73.8% of its pre-pandemic level from March 2019. However, there were 43.2 million fewer passenger trips in March 2023 compared with the same month in 2019.
On a monthly basis, public transit ridership in March increased by 12.2 million rides (+11.2%) from February, higher than the typical seasonal rise of just over 7% observed in the two years before the pandemic.
Financial situation continues to improve
In March 2023, transit agency operating revenues (excluding subsidies) were $281.3 million, an increase of $85.6 million (+43.7%) from March 2022, but $59.8 million lower than the pre-pandemic March 2019 level.
Note to readers
Survey data are revised on a monthly basis to reflect new information.
The data in this release are not seasonally adjusted.
This survey collects data on operating revenue (excluding subsidies) and the number of passenger trips from a panel of urban transit companies that represents at least 75% of revenues in each province and territory. Note that the panel is adjusted annually to maintain the 75% coverage and could differ slightly from what it was in the same month the previous year.
One-time payments from secondary and post-secondary institutions for academic-year student passes are typically reported as revenue during the early fall and early winter months.
Data prior to January 2017 can be found in table 23-10-0078-01.
The Transportation Data and Information Hub, a web portal developed jointly by Statistics Canada and Transport Canada, provides Canadians with online access to comprehensive statistics and measures on the country's transportation sector.
Contact information
For more information, or to enquire about the concepts, methods or data quality of this release, contact us (toll-free 1-800-263-1136; 514-283-8300; infostats@statcan.gc.ca) or Media Relations (statcan.mediahotline-ligneinfomedias.statcan@statcan.gc.ca).
- Date modified:


