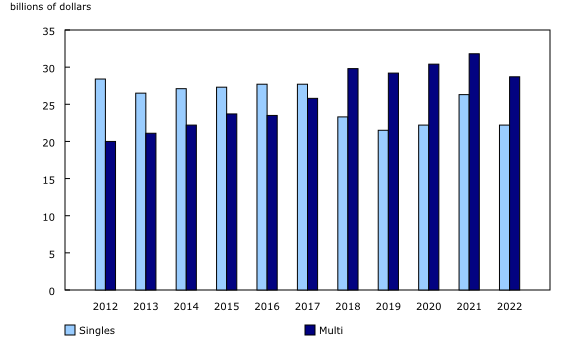
Chart 4
Value of residential building permits in constant dollars (2012)

Source(s):
Table 34-10-0066-01.
Chart description
This is a column clustered chart.
| Singles | Multi | |
|---|---|---|
| 2012 | 28.4 | 20.0 |
| 2013 | 26.5 | 21.1 |
| 2014 | 27.1 | 22.2 |
| 2015 | 27.3 | 23.7 |
| 2016 | 27.7 | 23.5 |
| 2017 | 27.7 | 25.8 |
| 2018 | 23.3 | 29.8 |
| 2019 | 21.5 | 29.2 |
| 2020 | 22.2 | 30.4 |
| 2021 | 26.3 | 31.8 |
| 2022 | 22.2 | 28.7 |
Source(s):
Table 34-10-0066-01.
- Date modified: