Energy statistics, October 2022
Released: 2023-01-09
Primary energy production posted a 2.9% increase in October 2022; the gain from natural gas (+7.8%) was partly mitigated by a decline in coal production (-8.1%) compared with October 2021.
Production of secondary energy products declined 0.9% year over year in October, as refined petroleum products was down 0.7%.
Meanwhile, global demand for Canadian energy products continued to rise. Exports of primary energy increased 3.1% compared with October 2021. Exports of crude oil (+3.7%) and natural gas (+5.0%) both posted gains.
In October, considering the Organization of Petroleum Exporting Countries Plus (OPEC+) announced production cuts, the United States released stocks from their strategic oil reserves, the increased air travel in part due to the removal of the last COVID-19 restrictions and the ongoing geopolitical strife in Europe, the Canadian energy sector has had to contend with several external influences and has had to remain adaptable in the face of global market turbulence.
For more information on energy in Canada, including production, consumption, international trade and much more, please visit the Canadian Centre for Energy Information website and follow #energynews on social media.
Synthetic crude production down due to maintenance
Production of crude oil and equivalent products edged up 0.4% to 24.5 million cubic metres in October. This was the weakest of the last four monthly year-over-year increases due to lower production of synthetic crude oil compared with October 2021.
Oil extraction rose 2.2% to 6.0 million cubic metres, as heavy crude oil continued to drive the overall increase, up 9.7% to 2.2 million cubic metres. Year to date production up to October of heavy crude oil was 8.1% higher than that of 2021 and 5.7% higher than that of 2019, prior to the COVID-19 pandemic. Production of light and medium crude oil was down 1.6% year over year in October 2022, following a 4.5% decrease in September.
Nearly offsetting the overall increase, oil sands extraction was down 1.7% to 16.0 million cubic metres in October. This decrease was driven by lower synthetic crude oil production, which fell 16.6% to 5.4 million cubic metres. Unplanned outages at some upgraders were the cause of the drop compared with the high level of production in 2021. In contrast, production of crude bitumen continued to rise, up 8.2% to 10.6 million cubic metres, another series high. Production of crude bitumen has exceeded 10 million cubic metres for the last four months.
According to the Raw Material Price Index, the price of crude oil and bitumen increased sharply (+19.1%) in October compared with the same month one year earlier. Prices were also up from September, largely due to the announcement that OPEC+ would cut production by 2 million barrels per day starting in November. This price increase for crude oil and bitumen was the first month-over-month increase since prices peaked in June 2022. There was still much uncertainty in the global energy market, especially in Europe, with consumption set to increase as colder temperatures arrived.
Production and consumption of refined petroleum products decline in October
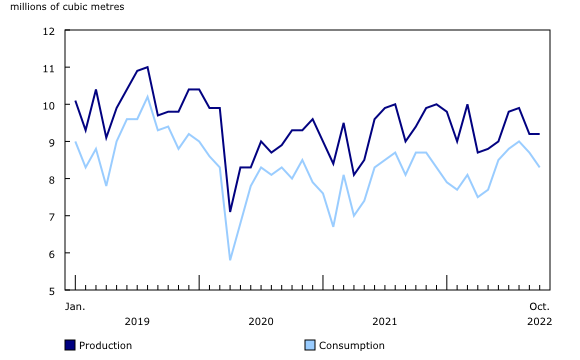
Production of finished petroleum products fell 2.8% to 9.2 million cubic metres in October compared with the same month one year earlier. Declines in the production of petroleum coke (-19.7%), still gas (-17.2%) and finished motor gasoline (-2.3%) were countered by increases in production of kerosene-type jet fuel (+50.4%) and distillate fuel oil (+2.7%).
In October, compared with the same month one year earlier, Canadian demand for finished petroleum products declined 4.8%, as shipments of distillate fuel oil (-6.5%) and finished motor gasoline (-0.6%) fell, while kerosene-type jet fuel continued to rise (+41.3%).
Air travel and, by extension, production and consumption of kerosene-type jet fuel declined sharply in mid-2020 as a result of the pandemic. However, production and consumption of jet fuel have both been increasing since spring 2021, reflecting an ongoing recovery in the travel industry. Despite this recovery, year to date production (by 21.5%) and consumption (by 23.4%) of jet fuel remained below their 2019 pre-pandemic levels.
According to the Industrial Product Price Index, prices for refined petroleum products rose 46.1% in October compared with one year earlier. Prices for kerosene-type jet fuel (+81.5%), diesel fuel (+67.8%) and finished motor gasoline (+22.0%) saw significant year-over-year increases.
Natural gas production reaches series high in October
Production of marketable natural gas in Canada rose 7.8% in October compared with one year earlier to 654.8 million gigajoules, the highest production level recorded since this series began in January 2016. Uncertainty in the global energy market and resulting high prices have continued to drive heightened levels of production.
Total deliveries of natural gas to the residential, commercial and institutional, and industrial sectors in Canada rose 5.1% compared with October 2021 to 364.1 million gigajoules. This increase was driven by a 7.0% uptick in deliveries to the industrial sector, which accounted for 212.6 million gigajoules. The overall increase was tempered by a 6.7% drop in consumption by the residential sector. According to Environment and Climate Change Canada data, various regions experienced unseasonably warm temperatures in October, which likely contributed to the decrease in residential natural gas consumption compared with October 2021. In October, many Canadians transition to heating, thus a greater demand for natural gas.
Inventories of natural gas held in Canadian facilities rose 5.3% in October compared with September, although inventories were 2.5% below the October 2021 level and 4.8% below the average level of 1.0 billion gigajoules for October for the previous five years.
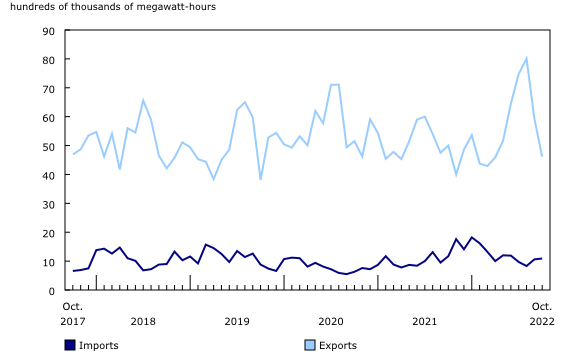
Demand for Canadian natural gas in the United States rose 5.0% year over year in October to 262.1 million gigajoules. Imports rose 21.0% to 89.6 million gigajoules.
According to the natural gas price index, Canadians paid 9.6% less in October compared with the same month one year earlier. This marked the first year-over-year price decline since January 2021.
Electricity generation and consumption unchanged in October, import and export down
Electricity generation in Canada was relatively unchanged in October, edging down 0.2% compared with October 2021.
Maintenance at Ontario's Pickering and Bruce Nuclear Generating Stations led to a significant decline in electricity from nuclear generation at the national level (-21.4%) in October compared with the same month one year earlier. Electricity generated from combustible sources also saw a decline (-5.0%). Partially offsetting these declines was a 4.4% increase in hydroelectric generation and an 18.8% rise in wind generation. Wind generation capacity increased notably in the past year.
In October, electricity consumption in Canada edged up 0.4% year over year.
Exports of electricity to the United States decreased 7.8% in October due to declines in exports from British Columbia (-53.1%), Quebec (-20.5%) and Ontario (-28.4%). Variable market prices for electricity and weather were contributing factors to the decline in exports. Exports from Manitoba counterbalanced the declines, rising 220.5%, as their generation and export levels rose sharply in 2022, following the impact of droughts on generation in 2021. Imports of electricity from the United States fell 7.1% in October.
Coal production and exports down in October
Total coal production in Canada was 3.1 million metric tonnes in October, a 19.5% decline from the same month one year earlier. Coal exports edged down 1.4% to 2.4 million metric tonnes, which represented 78.1% of total production.
Coke production rose sharply in October, up 15.4% year over year to 175 634 metric tonnes.
Note to readers
The consolidated energy statistics table (25-10-0079-01) presents monthly data on primary and secondary energy by fuel type in terajoules (crude oil, natural gas, electricity, coal, etc.) and supply and demand characteristics (production, exports, imports, etc.) for Canada. The table uses data from a variety of survey and administrative sources. Estimates are available starting with the January 2020 reference month. For more information, please consult the Consolidated Energy Statistics Table: User Guide.
The survey programs that support the energy statistics release include the following:
- Crude oil and natural gas (survey number 2198, tables 25-10-0036-01, 25-10-0055-01 and 25-10-0063-01). Data from July to September 2022 have been revised.
- Energy transportation and storage (survey number 5300, tables 25-10-0075-01 and 25-10-0077-01).
- Natural gas transmission, storage and distribution (survey numbers 2149, 5210 and 5215, tables 25-10-0057-01, 25-10-0058-01 and 25-10-0059-01).
- Refined petroleum products (survey number 2150, table 25-10-0081-01).
- Renewable fuel plant statistics (survey number 5294, table 25-10-0082-01). National estimates of renewable fuel plant statistics are presented by supply and disposition characteristics (production, shipments, inventories, etc.).
- Electric power statistics (survey number 2151, tables 25-10-0015-01 and 25-10-0016-01).
- Coal and coke statistics (survey numbers 2147 and 2003, tables 25-10-0045-01 and 25-10-0046-01). Data for September 2022 have been revised.
Data are subject to revisions. Energy data and other supporting data used in the text are revised on an ongoing basis for each month of the current year to reflect new information provided by respondents and updates to administrative data. Historical revisions are also performed periodically.
Definitions, data sources and methods for each survey program are available under their respective survey number.
The Energy Statistics Program uses respondent and administrative data.
Data in this release are not seasonally adjusted.
Contact information
For more information, or to enquire about the concepts, methods or data quality of this release, contact us (toll-free 1-800-263-1136; 514-283-8300; infostats@statcan.gc.ca) or Media Relations (statcan.mediahotline-ligneinfomedias.statcan@statcan.gc.ca).
- Date modified:


