
Chart 2
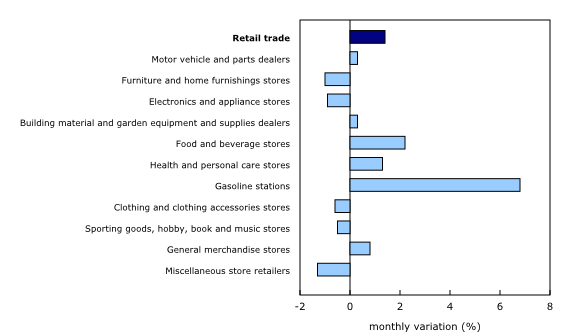
Sales increase in 6 of 11 subsectors in October
Source(s):
Table 20-10-0008-01.
Chart description
This is a bar clustered chart.
| monthly variation (%) | |
|---|---|
| Retail trade | 1.4 |
| Motor vehicle and parts dealers | 0.3 |
| Furniture and home furnishings stores | -1.0 |
| Electronics and appliance stores | -0.9 |
| Building material and garden equipment and supplies dealers | 0.3 |
| Food and beverage stores | 2.2 |
| Health and personal care stores | 1.3 |
| Gasoline stations | 6.8 |
| Clothing and clothing accessories stores | -0.6 |
| Sporting goods, hobby, book and music stores | -0.5 |
| General merchandise stores | 0.8 |
| Miscellaneous store retailers | -1.3 |
Source(s):
Table 20-10-0008-01.
- Date modified: