
Chart 1
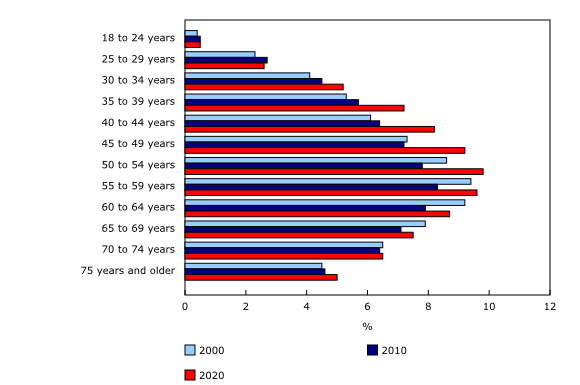
More Canadians aged 25 to 59 are landlords in 2020 than 20 years earlier
Source(s):
Annual Income Estimates for Census Families and Individuals (T1 Family File) (4105), custom tabulation.
Chart description
This is a bar clustered chart.
| 2000 | 2010 | 2020 | |
|---|---|---|---|
| 18 to 24 years | 0.4 | 0.5 | 0.5 |
| 25 to 29 years | 2.3 | 2.7 | 2.6 |
| 30 to 34 years | 4.1 | 4.5 | 5.2 |
| 35 to 39 years | 5.3 | 5.7 | 7.2 |
| 40 to 44 years | 6.1 | 6.4 | 8.2 |
| 45 to 49 years | 7.3 | 7.2 | 9.2 |
| 50 to 54 years | 8.6 | 7.8 | 9.8 |
| 55 to 59 years | 9.4 | 8.3 | 9.6 |
| 60 to 64 years | 9.2 | 7.9 | 8.7 |
| 65 to 69 years | 7.9 | 7.1 | 7.5 |
| 70 to 74 years | 6.5 | 6.4 | 6.5 |
| 75 years and older | 4.5 | 4.6 | 5.0 |
Source(s):
Annual Income Estimates for Census Families and Individuals (T1 Family File) (4105), custom tabulation.
- Date modified: