Railway carloadings, June 2022
Released: 2022-08-24
30.1 million metric tonnes
June 2022
1.3% 
(12-month change)
Highlights
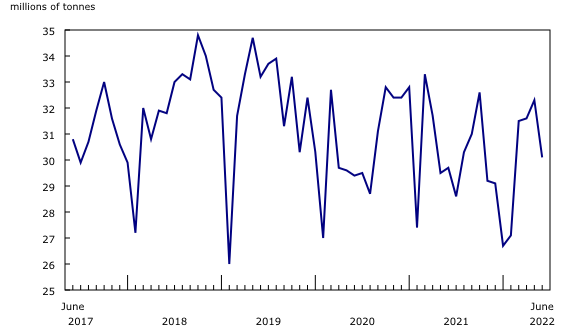
Canadian railways transported 30.1 million tonnes of freight in June, edging up 1.3% from June 2021 and the second consecutive month of year-over-year increase in tonnage. Large increases in loadings of iron ores and energy products offset the ongoing declines in grain shipments.
Also contributing to the overall increase were freight loadings from US rail connections, which reached 3.9 million tonnes in June, a 9.2% increase from June 2021.
To further explore current and historical data in an interactive format, please visit the Monthly Railway Carloadings: Interactive Dashboard.
Cumulative volume lagging
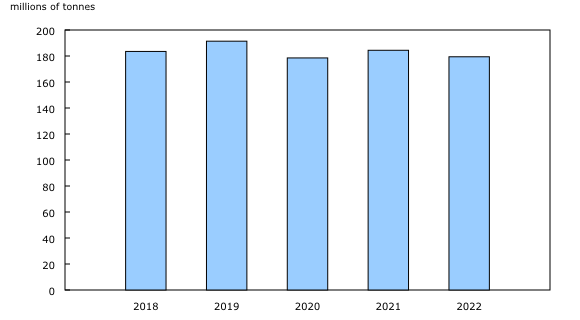
On a year-to-date basis through June, the cumulative volume of goods moved by rail totalled 179.4 million tonnes, down 2.7% from the same period in 2021. This was the second lowest cumulative total for the January-to-June period in five years, about 6.3% (or 12.0 million tonnes) below the level observed for the same period in 2019, before the COVID-19 pandemic.
June's year-over-year increase in total freight carried was the result of higher volumes in domestic non-intermodal loadings (mainly commodities) as well as traffic received from railway connections in the US.
Iron ores and concentrates loadings lead increase again
Non-intermodal freight loadings in Canada increased for the second month in a row, edging up 0.6% year over year to 23.1 million tonnes in June, driven by large tonnage increases in certain raw minerals and energy commodities.
Iron ores and concentrates led the pack, with loadings rising 23.9% (+865 000 tonnes) from June 2021, their fourth straight month of year-over-year increases. Some of this increase may reflect lingering effects from production disruptions at a Quebec–Labrador mine site from May to mid-June of 2021, due to a labour dispute.
Year over year, loadings of nickel ores and concentrates were also up (+71 000 tonnes), more than eight times their levels in June 2021 and the second consecutive month of increases.
Increases in carloadings of some energy commodities continued with rising fuel consumption and industrial production. For instance, loadings of coal posted a fifth consecutive year-over-year increase, rising 12.2% (+362 000 tonnes) from June 2021. This increase reflected strong global demand for industrial energy—in particular Asia—as well as higher gas prices and European energy supply constraints because of the war in Ukraine, creating stronger demand for coal.
Similarly, other refined petroleum and coal products (e.g., propane, butane), which have risen each month since April 2021, grew 70.7% (+287 000 tonnes) in June compared with the same month in 2021, following similar increases in May (+77.8%) and April (+79.7%).
As most pandemic-related travel restrictions have now been lifted across the globe, loadings of gasoline and aviation turbine fuel grew another 48.0% (+80 000 tonnes) year over year in June, marking the 15th consecutive increase in tonnage.
The overall increase in railway movements in energy commodities mirror the June data on Canadian international merchandise trade, with exports of energy products hitting a record high of $21.0 billion, representing a share of 30.0% of total exports.
Grains carloadings continue to slump
Grain shipments by rail have been declining since early 2021, amid the depletion of stocks along with lower crop production due to last summer's drought in the Prairies. Indeed, wheat loadings have declined year over year for the 14th straight month, slumping by 49.2% (-1 161 000 tonnes) in June and following similar year-over-year declines in May (-47.9%) and April (-49.6%).
Loadings of canola also continued their slide that began in March 2021, falling by 59.4% (-380 000 tonnes) year over year in June, marking their 16th consecutive month of such declines in tonnage.
Year-over-year, decreases were reported for other chemical products and preparations, with loadings down 62.1% (-117 000 tonnes) in June, the ninth consecutive month of declines.
Finally, loadings of wood pulp fell 19.3% (-108 000 tonnes) in June, an eighth consecutive monthly year-over-year decline, while loadings of plastic and rubber were down 23.0% (-83 000 tonnes).
Intermodal traffic down
In June, intermodal shipments—mainly containers—originating in Canada edged down after two consecutive months of year-over-year increases. Total tonnage slipped 2.7% from June 2021 to 3.1 million tonnes but remained just above the five-year average of 3.0 million tonnes for June.
American freight hits another high
Freight loadings from US rail connections hit another high in June (3.9 million tonnes), 9.2% greater than the previous year's loadings for June and above the 3.8 million tonnes reported in the same month in 2019. In fact, June marked the 15th straight month of year-over-year growth in this traffic, a run which seems to have resulted from a combination of factors.
At the beginning of the pandemic, factory closures and supply chain disruptions led to a 17.9% total decline in freight loadings from US connections between April and December 2020, compared with the same period in 2019. As volumes recovered to pre-pandemic levels in 2021, large year-over-year increases were an artifact of the lower 2020 volumes.
Starting in fall 2021, freight from US connections began to exceed the pre-pandemic level (2018 and 2019 average) by roughly 20% each month on average. The extent to which this increase resulted from enhanced trade, or reflected operational changes as mainline carriers further integrate their North American operations, is not entirely clear.
Other factors are at play; for example, a surge in traffic from US connections was observed following last November's flooding in southern British Columbia as some freight was rerouted around the affected areas. So far in 2022, roughly three-quarters (74.8%) of freight loadings from US connections were reported in the west, from Thunder Bay, Ontario to the Pacific coast.
Note to readers
The Monthly Railway Carloadings Survey collects data on the number of rail cars, tonnage, units and 20-feet equivalent units from railway transporters operating in Canada that provide for-hire freight services.
Cargo loadings from Armstrong, Ontario to the Atlantic coast are classified to the eastern division (eastern Canada), while loadings from Thunder Bay, Ontario to the Pacific coast are classified to the western division (western Canada).
Survey data are revised on a monthly basis to reflect new information.
The data in this release are not seasonally adjusted.
The Transportation Data and Information Hub provides Canadians with online access to comprehensive statistics and measures on the country's transportation sector.
Contact information
For more information, or to enquire about the concepts, methods or data quality of this release, contact us (toll-free 1-800-263-1136; 514-283-8300; infostats@statcan.gc.ca) or Media Relations (statcan.mediahotline-ligneinfomedias.statcan@statcan.gc.ca).
- Date modified:


