Monthly estimates of business openings and closures, February 2022
Archived Content
Information identified as archived is provided for reference, research or recordkeeping purposes. It is not subject to the Government of Canada Web Standards and has not been altered or updated since it was archived. Please "contact us" to request a format other than those available.
Released: 2022-05-30
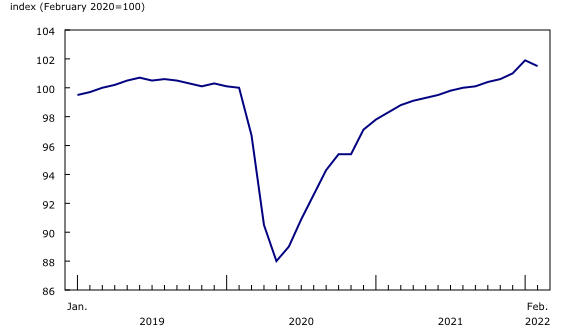
In February 2022, the number of active businesses decreased (-0.4%; -3,555) compared with the previous month for the first time since May 2020. This decrease was largely driven by an increase in the business closure rate, from 4.1% in January to 5.0% in February. The business opening rate held steady at 4.9%.
Transportation and warehousing (-2.6%; -1,367) and professional, scientific and technical services (-0.4%; -435) led the decline in the number of active businesses in February 2022. The decrease in the national number of active businesses was driven by Ontario (-0.5%; -1,613) and Alberta (-0.5%; -614).
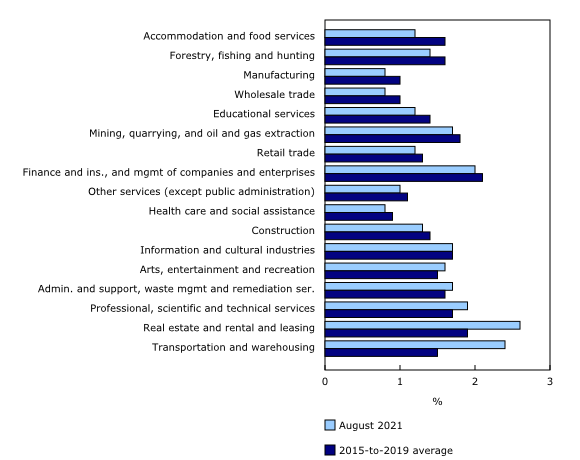
The series on temporary business closures and exits (or "permanent closures") is now updated to include data up to August 2021. The exit rate rose slightly from 1.5% in July to 1.6% in August 2021, right below its historical average of 1.7%.
In August 2021, the exit rate remained above its historical average in transportation and warehousing (2.4% vs 1.5%) and real estate and rental and leasing (2.6% vs 1.9%) for the ninth and eighth consecutive month, respectively. Professional, scientific and technical services (1.9% vs 1.7%), administrative and support, waste management and remediation services (1.7% vs 1.6%) and arts, entertainment and recreation (1.6% vs 1.5%) were the only other industries where the exit rate was above its historical average.
The number of active businesses in some industries and provinces has not yet returned to pre-pandemic levels
February 2022 was the 24th month of the COVID-19 pandemic in Canada. While the number of active businesses in the business sector has been above its February 2020 pre-pandemic level since September 2021, the situation is different across sectors.
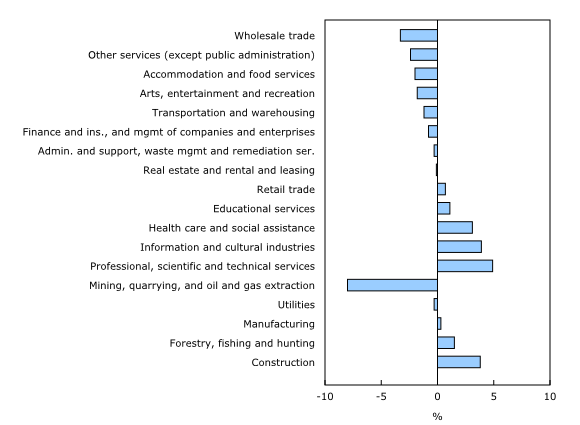
In the goods-producing sector, the number of active businesses in the mining, quarrying, and oil and gas extraction industry has not returned to its pre-pandemic level after two years. In February 2022, the gap relative to February 2020 was 456 (-1.9%). The number of active businesses in manufacturing rose by 0.2% (+103) in February 2022 and settled above its February 2020 level for the second time since the onset of the pandemic. The number of active businesses has generally been above its pre-pandemic level in the other goods-producing sectors since December 2020.
In February 2022, the number of active businesses was below its February 2020 level in 8 of the 13 services-producing industries. The number of active businesses has generally been increasing in accommodation and food services and other tourism industries since June 2020, but remained below its respective pre-pandemic level in February 2022. The number of active businesses was above its February 2020 level for the third consecutive month in retail trade and the second consecutive month in educational services. Information and cultural industries, professional, scientific and technical services and, health care and social assistance industries have posted higher levels of active businesses than February 2020 since late 2020 or early 2021.
After two years of the pandemic, most provinces and territories have settled above or close to their respective February 2020 levels in terms of number of active businesses. Alberta (-1,501) and Newfoundland and Labrador (-441) were the only provinces where the number of active businesses has been below its February 2020 level since the onset of the pandemic.
Note to readers
April 2022's release introduced a new process for seasonally adjustment in the presence of the outliers generated by the response to the COVID-19 pandemic. The new process has a greater number of outliers that are explicitly recognized at the outset of the seasonal adjustment process. This leads to a greater number of outliers being taken into account than was previously occurring. Examinations of seasonally adjusted data using the new process show results that are more stable over time and produce smaller revisions.
Every new month of data leads to a revision of the previously released data due to such factors as the seasonal adjustment process and a new version of the Generic Survey Universe File (or vintage of the Business Register). As such, the estimates may vary compared with a previous release.
Openings are defined as businesses with employment in the current month and no employment in the previous month, while closures are defined as businesses that had employment in the previous month, but no employment in the current month. Continuing businesses are those that have employees in both months, and the active population in any given month is the number of opening and continuing businesses in that month. Reopening businesses are defined as opening businesses that were also active in a previous month (that is, they closed in a given month and had positive employment in a subsequent month). In contrast, entrants are opening businesses that were not active in a previous month.
The definition of exits is based on the Longitudinal Employment Analysis Program (LEAP) annual exits. Because the LEAP definition can require up to 24 months of data to be counted as an exit, projections of exits using predicted growth rates are implemented using a regression model of exits on closures of more than six months. As a result, there are no published exits in the last six months. A temporary business closure is the difference between closures and exits. For more information on temporary business closures and exits, see "Defining and measuring business exits using monthly data series on business openings and closures."
A business is defined as an enterprise operating in a particular geography and industry.
The vast majority of businesses operate in one industry and one location or geography. For these businesses, in the monthly estimates of openings and closures, they will be counted once at the national/provincial level. For example, a retailer in Windsor, Ontario, will be counted as an active business in the Ontario estimates and once in the national estimates.
Some businesses can have multiple operations, and these can be in different industries and geographies. For such businesses, in the monthly estimates of openings and closures, they can be counted more than once because they are active in multiple industries or geographies. For example, if a retailer has operations in both Alberta and Ontario, it will be counted as an active business in both provinces, but only once at the national level because it represents only one active firm. Similarly, a firm with retail and wholesale operations will be counted in both industries when individual industries are examined. However, when the business sector is examined, the firm counts only once because at that level it represents one firm active in the business sector.
Contact information
For more information, or to enquire about the concepts, methods or data quality of this release, contact us (toll-free 1-800-263-1136; 514-283-8300; infostats@statcan.gc.ca) or Media Relations (statcan.mediahotline-ligneinfomedias.statcan@statcan.gc.ca).
- Date modified:


