Energy statistics, January 2022
Archived Content
Information identified as archived is provided for reference, research or recordkeeping purposes. It is not subject to the Government of Canada Web Standards and has not been altered or updated since it was archived. Please "contact us" to request a format other than those available.
Released: 2022-04-08
For the second consecutive month, primary energy production posted a modest decline. In January 2022, production fell 0.7% to 2.0 million terajoules, following a 1.0% decrease in December, compared with the same month one year ago. These recent decreases followed an extended period of recovery through 2021, as demand for energy products and production returned. This was after the significant impact of the COVID-19 pandemic on the energy sector in 2020.
Despite January's small decline, primary energy production remained at the highest level since January 2021. Lower production of crude oil (-4.5%) and coal (-26.0%) were offset by higher production of natural gas (+7.0%).
Secondary energy production rose 5.9% year over year in January, powered by a 5.3% increase in production of refined petroleum products.
Total exports of primary and secondary energy rose 1.3% to 1.3 million terajoules compared with January 2021. Exports of crude oil (764.9 thousand terajoules), increased 0.7% year over year in January 2022, which followed a 5.6% rise in December 2021.
The year 2022 began with various new and ongoing challenges that had direct and indirect impacts on the energy sector. Colder-than-usual temperatures, particularly in western Canada, affected the output of some crude oil production facilities, while demand was on the rise. The Omicron variant, which emerged in late 2021, in addition to escalating geopolitical unrest in Eastern Europe, sparked considerable uncertainty in terms of the stability of energy supply lines and the overall state of the global economy. As such, industrial prices for some energy products were on a steep increase in January.
For more information on energy in Canada, including production, consumption, international trade and much more, please visit the Canadian Centre for Energy Information website and follow #energynews on social media.
Crude oil production down
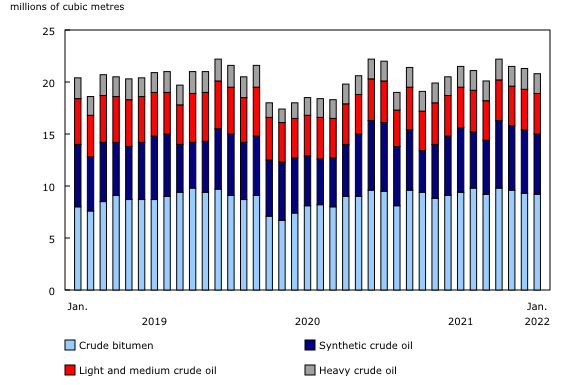
Production of crude oil and equivalent products decreased by 4.6% in January, to 23.0 million cubic metres. This was the second consecutive decline as colder-than-average temperatures in western Canada continued to hamper some operations.
Oil sands extraction fell 6.7% to 14.9 million cubic metres. Synthetic crude production was lower than usual for the month of January, down 12.1% to 5.8 million cubic metres. At the same time, production of crude bitumen was also down 2.9% to 9.2 million cubic metres. In addition to the extreme cold, some oil sands facilities were operating with only critical staff because of the spread of the Omicron variant in January.
Oil extraction was down 1.9% to 5.8 million cubic metres, because of lower production of light and medium crude, which decreased 2.6% to 3.9 million cubic metres. Heavy crude production also edged down 0.5% to 1.9 million cubic metres.
Following two consecutive monthly price decreases from a recent price high in October, the crude oil and bitumen price index surged 17.7% in January. This was the highest price since June 2014, as the fear of prolonged lockdowns caused by the emergence of the Omicron variant and geopolitical tensions beginning to escalate in Eastern Europe created much uncertainty in the market. According to the US Energy Information Agency, consumption of petroleum products in Canada decreased 3.7% from December 2021.
Exports of crude oil and equivalent edged up 0.7% to 19.4 million cubic metres in January. Exports by pipeline to the United States rose 3.9% to 17.7 million cubic metres, while exports to the United States by other means dropped 26.1% to 1.5 million cubic metres. Exports to other countries were also down (-6.0%).
Imports of crude oil and equivalent fell 25.9% to 3.0 million cubic metres, driven by lower imports to refineries, down 35.2% to 1.9 million cubic metres. Imports from countries other than the United States also declined 13.8% to 1.1 million cubic metres in January.
Production of refined petroleum products continues to increase
Production of finished petroleum products rose 7.8% in January to 9.4 million cubic metres. This was the third consecutive monthly year-over-year increase. Finished motor gasoline production drove the overall increase, up 14.7% to 2.8 million cubic metres. At the same time, production of distillate fuel oil rose 4.9% to 3.5 million cubic metres, and jet fuel climbed 30.2% to 0.4 million cubic metres.
One year ago, as COVID-19 cases surged, widespread lockdowns in several provinces reduced Canadian refinery activity. In January 2022, despite the Omicron variant, economic activity was less affected by various provincial government lockdowns. As such, demand for finished petroleum products rose 4.6% to 7.8 million cubic metres.
Consumption of finished motor gasoline was the main contributor to this increase, up 10.1% to 3.2 million cubic metres. In addition, airline travel continued to rebound as demand for jet fuel increased 16.9%, the 10th consecutive increase. According to aircraft movement statistics, aircraft movement at Canada's major airports rose 4.6% in January. Meanwhile, demand for distillate fuel oil fell 0.5% to 2.6 million cubic metres.
As crude oil prices rose, so did prices for refined petroleum products, which climbed 11.0% in January 2022 from December 2021. Both motor gasoline (+9.0%) and jet fuel (+11.3%) contributed to high prices for refined products.
Exports of finished petroleum products were up 9.7% to 1.6 million cubic metres, driven by an 18.5% rise in exports of distillate fuel oil to 1.0 million cubic metres. The overall increase was somewhat offset by lower exports of motor gasoline (-25.8%) and jet fuel (-24.4%).
In contrast, total imports fell 22.9% to 0.5 million cubic metres, attributable to a 75.1% decline in distillate fuel oil. Offsetting the decline were imports of motor gasoline, up 67.9% to 0.2 million cubic metres.
Increases continue in natural gas production and consumption
In January, production of marketable natural gas continued on an upward trend, increasing 7.0% to 627.3 million gigajoules, the seventh consecutive monthly year-over-year gain. The boost in year-over-year production was largely attributable to less strict COVID-19 restrictions in January 2022, which had less economic impact, compared with the same month one year ago. In January 2021, to curtail the spread of COVID-19, various provincial governments mandated lockdowns and curfews, which may have weakened the demand for natural gas because of slower economic activity.
Most of the production was concentrated in Alberta (66.3%) and British Columbia (32.4%).
Total deliveries of natural gas to Canadian consumers rose 16.0% year over year to 570.0 million gigajoules in January. This was primarily because of higher demand from the industrial sector (+9.5%). The industrial sector in Alberta received 37.2% of all natural gas delivered in Canada in January.
Deliveries to commercial and institutional (+25.2%) and residential (+26.5%) sectors were also up.
Following a 3.7% decline in December 2021, exports of natural gas by pipeline to the United States increased 3.8% to 315.2 million gigajoules in January 2022. British Columbia was the key exporter in Canada, with a 44.3% share of all natural gas exports. Imports of natural gas declined 11.0% to 105.1 million gigajoules, mostly because of lower demand from Ontario.
Overall, Canadian consumers paid 21.2% more year over year for natural gas in January 2022, according to the Consumer Price Index. The upward pressure on natural gas prices was driven by colder-than-normal weather in January across western Canada, which increased demand for gas used for heating and power generation. The residential sector in the western provinces received close to half (46.5%) of all natural gas delivered to residential consumers in Canada in January.
Electricity generation and consumption increase year over year
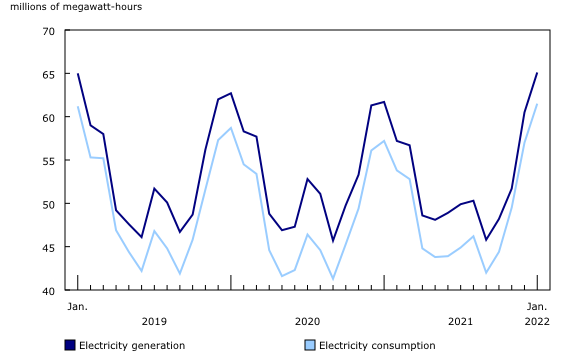
Electricity generation in Canada rose 5.4% to 65.1 million megawatt-hours (MWh) in January 2022, following a 1.3% decrease in December 2021. This was the first year-over-year monthly increase since September 2021 (+0.3%). The rise was primarily caused by increased electricity generation from non-renewable combustibles (+15.7%), and wind (+31.2%). Most of the increase was attributable to Quebec and Ontario. By contrast, electricity generation in Manitoba continued to decline, because of low water levels in the province's reservoirs.
Electricity consumption in Canada increased 7.6% year over year in January to 61.5 million MWh. The year-over-year increase was largely because of higher demand for electricity in Quebec (+15.9%). According to Environment and Climate Change Canada data on heating degree days, January 2022 temperatures were on average colder than in January 2021 in Quebec.
Higher demand for electricity continued to put upward pressure on prices in January. The Electric Power Selling Price Index for industrial and commercial users rose 6.5% month over month in January 2022, after increasing 0.4% in December 2021.
Following a 17.8% year-over-year decrease in December 2021, electricity exports to the United States declined 1.2% to 5.4 million MWh in January 2022. Lower exports from Manitoba (-484.6 thousand MWh or -85.9%) and Quebec (-332.8 thousand MWh or -14.1%) were the main contributors to the year-over-year decline. In contrast, imports of electricity from the United States were up 108.9% to 1.8 million MWh. This increase in demand for imported electricity was mainly because of Manitoba's current reduced capacity (low water levels) to generate hydroelectricity.
Production and exports of coal decline year over year
Total coal production fell for the second consecutive month, down 6.8% to 3.3 million tonnes in January. International demand for coal also continued to decline as exports dropped 16.5% year over year to 1.6 million tonnes.
Coke production continued its downward trend, dropping 27.2% to 138 332 tonnes in January.
Note to readers
The consolidated energy statistics table (25-10-0079-01) presents monthly data on primary and secondary energy by fuel type in terajoules (crude oil, natural gas, electricity, coal, etc.) and supply and demand characteristics (production, exports, imports, etc.) for Canada. The table uses data from a variety of survey and administrative sources. Estimates are available starting with the January 2020 reference month. For more information, please consult the Consolidated Energy Statistics Table: User Guide.
The survey programs that support the energy statistics release include the following:
- Crude oil and natural gas (survey number 2198, tables 25-10-0036-01, 25-10-0055-01 and 25-10-0063-01). Data from January to September 2021 have been revised.
- Energy transportation and storage (survey number 5300, tables 25-10-0075-01 and 25-10-0077-01).
- Natural gas transmission, storage and distribution (survey numbers 2149, 5210 and 5215, tables 25-10-0057-01, 25-10-0058-01 and 25-10-0059-01).
- Refined petroleum products (survey number 2150, table 25-10-0081-01).
- Renewable fuel plant statistics (survey number 5294, table 25-10-0082-01). National estimates of renewable fuel plant statistics are presented by supply and disposition characteristics (production, shipments, inventories, etc.).
- Electric power statistics (survey number 2151, tables 25-10-0015-01 and 25-10-0016-01). Data for December 2021 have been revised.
- Coal and coke statistics (survey numbers 2147 and 2003, tables 25-10-0045-01 and 25-10-0046-01).
Data are subject to revisions. Energy data are revised on an ongoing basis for each month of the current year to reflect new information provided by respondents and updates to administrative data. Historical revisions are also performed periodically.
Definitions, data sources and methods for each survey program are available under their respective survey number.
The Energy Statistics Program uses respondent and administrative data.
Data in this release are not seasonally adjusted.
For more information about liquid renewable fuels, consult Liquid renewable fuels in Canada, 2020.
Contact information
For more information, or to enquire about the concepts, methods or data quality of this release, contact us (toll-free 1-800-263-1136; 514-283-8300; infostats@statcan.gc.ca) or Media Relations (statcan.mediahotline-ligneinfomedias.statcan@statcan.gc.ca).
- Date modified:


