
Chart 1
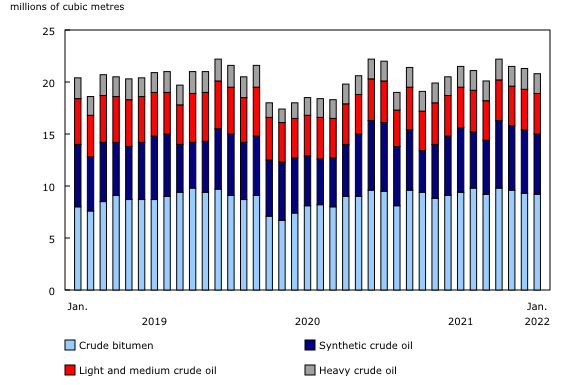
Production of crude oil, by type of product
Source(s):
Table 25-10-0063-01.
Chart description
This is a column stacked chart.
| Crude bitumen | Synthetic crude oil | Light and medium crude oil | Heavy crude oil | |
|---|---|---|---|---|
| January 2019 | 8.0 | 6.0 | 4.4 | 2.0 |
| February 2019 | 7.6 | 5.2 | 4.0 | 1.8 |
| March 2019 | 8.5 | 5.7 | 4.5 | 2.0 |
| April 2019 | 9.1 | 5.1 | 4.4 | 1.9 |
| May 2019 | 8.7 | 5.1 | 4.5 | 2.0 |
| June 2019 | 8.7 | 5.5 | 4.4 | 1.8 |
| July 2019 | 8.7 | 6.1 | 4.2 | 1.9 |
| August 2019 | 9.0 | 6.0 | 4.0 | 2.0 |
| September 2019 | 9.4 | 4.6 | 3.8 | 1.9 |
| October 2019 | 9.8 | 4.4 | 4.7 | 2.1 |
| November 2019 | 9.4 | 4.9 | 4.7 | 2.0 |
| December 2019 | 9.7 | 5.8 | 4.6 | 2.1 |
| January 2020 | 9.1 | 5.9 | 4.5 | 2.1 |
| February 2020 | 8.7 | 5.5 | 4.3 | 2.0 |
| March 2020 | 9.1 | 5.7 | 4.7 | 2.1 |
| April 2020 | 7.1 | 5.4 | 4.1 | 1.4 |
| May 2020 | 6.7 | 5.6 | 3.8 | 1.3 |
| June 2020 | 7.4 | 5.3 | 3.8 | 1.5 |
| July 2020 | 8.1 | 4.8 | 3.9 | 1.7 |
| August 2020 | 8.2 | 4.4 | 4.0 | 1.8 |
| September 2020 | 8.0 | 4.7 | 3.8 | 1.8 |
| October 2020 | 9.0 | 5.0 | 3.9 | 1.9 |
| November 2020 | 9.0 | 6.0 | 3.8 | 1.8 |
| December 2020 | 9.6 | 6.7 | 4.0 | 1.9 |
| January 2021 | 9.5 | 6.6 | 4.0 | 1.9 |
| February 2021 | 8.1 | 5.7 | 3.5 | 1.7 |
| March 2021 | 9.6 | 5.8 | 4.1 | 1.9 |
| April 2021 | 9.4 | 4.0 | 3.8 | 1.9 |
| May 2021 | 8.8 | 5.2 | 4.0 | 1.9 |
| June 2021 | 9.1 | 5.7 | 3.9 | 1.8 |
| July 2021 | 9.4 | 6.2 | 3.9 | 2.0 |
| August 2021 | 9.8 | 5.4 | 4.0 | 1.9 |
| September 2021 | 9.2 | 5.2 | 3.8 | 1.9 |
| October 2021 | 9.8 | 6.5 | 3.9 | 2.0 |
| November 2021 | 9.6 | 6.2 | 3.8 | 1.9 |
| December 2021 | 9.3 | 6.1 | 3.9 | 2.0 |
| January 2022 | 9.2 | 5.8 | 3.9 | 1.9 |
Source(s):
Table 25-10-0063-01.
- Date modified: