Police-reported hate crime, 2020
Archived Content
Information identified as archived is provided for reference, research or recordkeeping purposes. It is not subject to the Government of Canada Web Standards and has not been altered or updated since it was archived. Please "contact us" to request a format other than those available.
Released: 2022-03-17
In the first year of the COVID-19 pandemic, police reported 2,669 hate crimes in Canada, up 37% from 2019. This marks the largest number of police-reported hate crimes since comparable data became available in 2009. In 2020, police-reported hate crimes targeting race or ethnicity almost doubled (+80%) compared with a year earlier, accounting for the vast majority of the national increase in hate crimes.
Today, Statistics Canada released a detailed analysis in the Juristat article "Police-reported hate crime in Canada, 2020" and the accompanying infographic "Infographic: Police-reported hate crime in Canada, 2020."
The pandemic further exposed and exacerbated issues related to community safety and discrimination in Canada, including hate crime. According to a crowdsourcing initiative conducted early in the pandemic, respondents belonging to visible minority groups were three times more likely to have perceived an increase in race-based harassment or attacks compared with the rest of the population (18% vs. 6%). This difference was most pronounced among Chinese (30%), Korean (27%), and Southeast Asian (19%) participants. Furthermore, people designated as visible minorities and Indigenous peoples considered their neighbourhoods to be less safe during the pandemic.
Hate-motivated crime rises sharply, while other crime drops
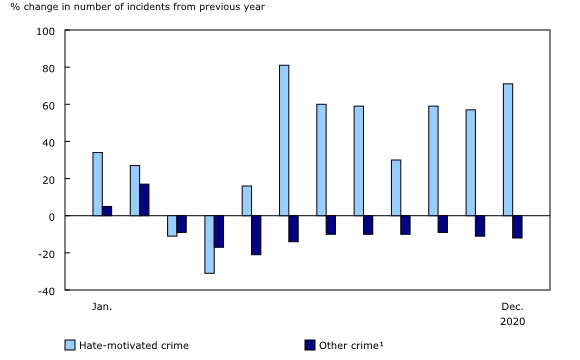
While police-reported hate crimes increased sharply, the overall police-reported crime rate (excluding traffic offences) decreased by 10% from 2019 to 2020. In the first month and a half of the pandemic, in which initial lockdown restrictions were in place, the number of police-reported hate crimes and other crimes was lower compared with the same period in 2019. From May to December 2020, however, other crimes remained lower month to month compared with 2019 (-12%), while hate-motivated crimes increased substantially (+52%).
As with other crimes, self-reported data provide further insight into hate-motivated crimes as a complement to police-reported data. While the number of hate crimes rose sharply in 2020, this may still represent an underestimation. Self-reported data show that the majority of criminal incidents perceived to be motivated by hate are not reported to police. Specifically, according to the 2019 General Social Survey (GSS) on Canadians' Safety (Victimization), Canadians were the victims of over 223,000 criminal incidents that they perceived as being motivated by hate in the 12 months that preceded the survey (3% of self-reported incidents). Approximately one in five (22%) of these incidents were reported to the police.
Most provinces and two territories report increases in hate crimes
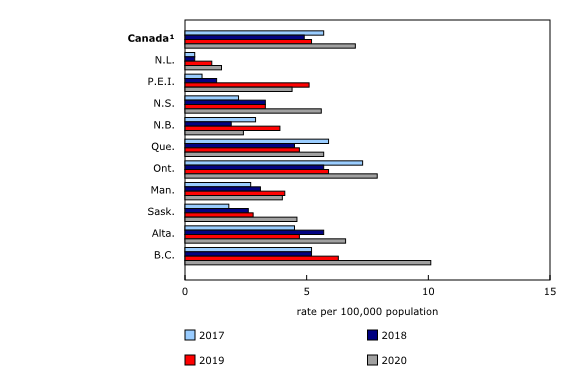
When population size is accounted for, the rate of police-reported hate crime in Canada from 2019 to 2020 rose 35% to 7.0 incidents per 100,000 population. The most notable increases in police-reported hate crime rates among the provinces were recorded in Nova Scotia (+70%; +23 incidents), British Columbia (+60%; +198 incidents), Saskatchewan (+60%; +20 incidents), Alberta (+39%; +84 incidents), and Ontario (+35%; +316 incidents). No increases were reported by Manitoba, Prince Edward Island, New Brunswick and the Northwest Territories. The relatively small population counts and number of hate crimes in the territories typically translate to more unstable rates, making year-over-year comparisons less reliable.
The rate of hate crime was highest in British Columbia (10.1 incidents per 100,000 population), Ontario (7.9 incidents per 100,000 population) and Alberta (6.6 incidents per 100,000 population).
While the majority (84%) of police-reported hate crimes in Canada occurred in large urban centres or census metropolitan areas (CMAs), rates increased the same (+35%) in CMAs and non-CMAs, which include smaller cities, small towns or rural areas.
Non-violent and violent hate crimes up in 2020
More than half (57%) of all hate crime incidents reported by police were non-violent in 2020, while the remaining 43% were violent. These proportions were similar to recent years. Both non-violent (+41%) and violent (+32%) hate crimes increased compared with 2019, contributing fairly equally to the overall increase in hate crime in 2020.
The increase in non-violent hate crime was largely the result of more incidents of general mischief (+33%). The rise in violent hate crime was the result of more incidents of several violations, including criminal harassment (+70%), major or aggravated (level 2 and 3) assault (+58%), common assault (+23%) and uttering threats (+11%).
As is typical of police-reported hate crime historically, mischief (general mischief and mischief towards property used primarily for worship or by an identifiable group) was the most common hate crime-related offence, accounting for almost half (44%) of all hate crime incidents.
For all violent hate crimes reported by police between 2011 and 2020 and for which a victim was identified, 66% of victims were men or boys, and 34% were women or girls. Relative to other hate crime motivations, incidents targeting the Muslim population (47%) were more likely to involve women and girls. This was also the case for hate crimes targeting the Indigenous population, where 44% of victims were women or girls.
Crimes motivated by hatred of a race or ethnicity nearly double
The year 2020 was marked not only by the global pandemic, but also the rise of social movements seeking justice and racial and social equity. It is not possible to link police-reported hate crime incidents directly to particular events, but coverage and public discourse around particular issues can increase awareness and exacerbate or entice negative reactions from people who oppose the movement.
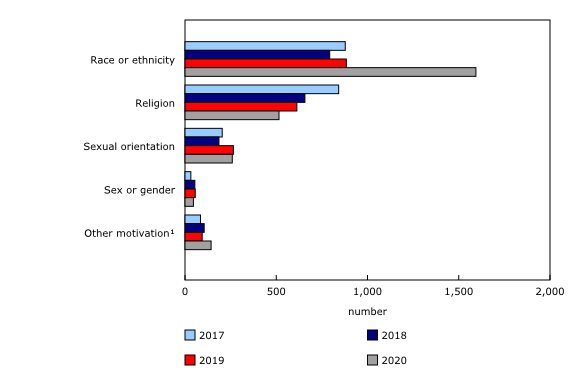
The number of police-reported hate crimes targeting race or ethnicity almost doubled (+80%) in 2020 compared with a year earlier, accounting for the vast majority of the national increase. Police reported 1,594 crimes motivated by hatred of a race or ethnicity. Much of the rise in these types of hate crimes was the result of crimes targeting the Black population (+318 incidents or +92%), the East or Southeast Asian population (+202 incidents or +301%), the Indigenous population (+44 incidents or +152%), and the South Asian population (+38 incidents or +47%). In 2020, police reported the highest number of hate crimes targeting each of these population groups since comparable data became available.
Despite an increase, hate crimes targeting Indigenous populations continue to account for relatively few police-reported hate crimes
The number of police-reported hate crimes targeting Indigenous people—First Nations people, Métis or Inuit—more than doubled from 29 in 2019 to 73 in 2020. Despite the increase, incidents against Indigenous people continued to account for a relatively small proportion (3%) of police-reported hate crimes. Self-reported data indicate that rates of violent victimization among Indigenous people were more than double that among non-Indigenous people, but also showed that Indigenous people have lower confidence in police, the justice system and other institutions than their non-Indigenous counterparts. Different degrees of confidence in the police or other institutions among different populations may affect the likelihood that a particular crime is reported to the police.
Hate crimes targeting religion down for the third year in a row
Following a peak in 2017, hate crimes targeting religion declined for the third year in a row, dropping 16% in 2020. Despite the recent declines, the 515 incidents targeting religion in 2020 remained higher than the number of incidents recorded annually prior to 2017. Among reported hate crimes targeting a religion in 2020, the Jewish and Muslim populations continued to be the most frequent targets, accounting for 62% and 16% of crimes against a religion, respectively.
These results mirror findings on self-reported discrimination from the 2019 GSS on Victimization. According to the GSS, the Jewish and Muslim populations were significantly more likely to report experiencing discrimination on the basis of their religion than most other religious affiliations.
The decrease in hate crimes targeting a religion was primarily because hate crimes targeting the Muslim population dropped by 55% in 2020, from 182 incidents to 82 incidents. Declines were mostly in Quebec (-50 incidents), Ontario (-27 incidents) and Alberta (-19 incidents).
In contrast, incidents targeting the Jewish population increased 5% in 2020, from 306 to 321 incidents. Among the provinces and territories, notable changes occurred in Ontario (+15 incidents), Quebec (+10 incidents) and Manitoba (-13 incidents).
Slight decrease in crimes motivated by hatred of a sexual orientation
According to the 2018 Survey of Safety in Public and Private Spaces, an estimated 1 million people in Canada reported their sexual orientation as lesbian, gay, bisexual, pansexual, asexual, a sexual orientation on the asexual spectrum, or a sexual orientation that is not otherwise classified. Compared with heterosexual Canadians, this population was more likely to report having been violently victimized in their lifetime and were more likely to have experienced inappropriate behaviours in public and online. At the same time, they were less likely to report being physically assaulted to the police.
Although the number of police-reported hate crimes targeting sexual orientation was down by 2% in 2020, the 259 incidents were the second highest reported since comparable data have been available since 2009. About 8 in 10 (81%) of these crimes specifically targeted the gay and lesbian community, while the remainder targeted the bisexual orientation (2%) and other sexual orientations, such as asexual, pansexual or other non-heterosexual orientations (9%). An additional 7% were incidents where the targeted sexual orientation was reported as unknown.
As was the case in previous years, violent crimes accounted for almost 6 in 10 (58%) hate crimes targeting a sexual orientation. In comparison, one-fifth (20%) of hate crimes targeting religion and less than half (47%) of those targeting race or ethnicity were violent.
Note to readers
Hate crimes target the integral and visible parts of a person's identity, and a single incident can affect the wider community. A hate crime incident may be carried out against a person or property and may target race, colour, national or ethnic origin, religion, sexual orientation, gender identity or expression, language, sex, age, mental or physical disability, or any other similar factor. Additionally, there are four specific offences listed as hate propaganda or hate crimes in the Criminal Code of Canada: advocating genocide, public incitement of hatred, wilful promotion of hatred, and mischief motivated by hate in relation to property used by an identifiable group.
Police-reported hate crime data have been collected on an annual basis since 2006 and, since 2010, data on motivations have been reported by police services that cover over 99% of the population of Canada. Police determine whether a crime was motivated by hatred. They indicate the type of motivation based on information gathered during the investigation and common national guidelines for record classification. Hate crime counts include both confirmed and suspected hate crime incidents. Overall, hate-motivated crime accounts for a small proportion of all police-reported crime (around 0.1% of all non-traffic-related offences). Police data on hate crimes reflect only those incidents that come to the attention of police and are classified as hate crimes.
Fluctuations in the annual number of incidents may be because of a true change in the volume of hate crimes, but they can also be influenced by changes in local police service practices, police engagement with various communities, and the willingness of victims to report incidents to police. Increased reporting to police could be linked to greater community outreach by police, increased public education and awareness, or heightened sensitivity after high-profile events. The number of hate crimes presented in this release likely undercounts the true extent of hate crime in Canada, since not all crimes are reported to police.
While crowdsourcing initiatives can be conducted more quickly than traditional survey methods—and can provide more timely information—the data are not collected using probability-based sampling. As a result, the findings cannot be generalized to the overall Canadian population.
There is not a direct correspondence between the number of police-reported hate crimes in the Uniform Crime Reporting Survey and the number of self-reported incidents of victimization perceived to be motivated by hate collected in the General Social Survey as the collection methodologies and reporting definitions differ between the two surveys.
A census metropolitan area (CMA) consists of one or more neighbouring municipalities situated around a major urban core. A CMA must have a total population of at least 100,000, of which 50,000 or more live in the urban core. To be included in the CMA, other adjacent municipalities must have a high degree of integration with the central urban core, as measured by commuting flows derived from census data. A CMA typically comprises more than one police service. CMA populations have been adjusted to follow policing boundaries. The Oshawa CMA is excluded from this analysis owing to the incongruity between the police service jurisdictional boundaries and the CMA boundaries. In 2020, coverage for each CMA was virtually 100%, except in Toronto (91%) and Hamilton (75%).
Available tables: 35-10-0066-01, 35-10-0067-01 and 35-10-0191-01.
Products
The article "Police-reported hate crime in Canada, 2020" is now available as part of the publication Juristat (85-002-X). The infographic "Infographic: Police-reported hate crime in Canada, 2020," which is part of the series Statistics Canada — Infographics (11-627-M), is now available.
ms__id1Contact information
For more information, or to enquire about the concepts, methods or data quality of this release, contact us (toll-free 1-800-263-1136; 514-283-8300; infostats@statcan.gc.ca) or Media Relations (statcan.mediahotline-ligneinfomedias.statcan@statcan.gc.ca).
- Date modified:


