Monthly Mineral Production Survey, December 2021
Archived Content
Information identified as archived is provided for reference, research or recordkeeping purposes. It is not subject to the Government of Canada Web Standards and has not been altered or updated since it was archived. Please "contact us" to request a format other than those available.
Released: 2022-02-18
The total value of shipments of minerals declines during the last quarter of 2021
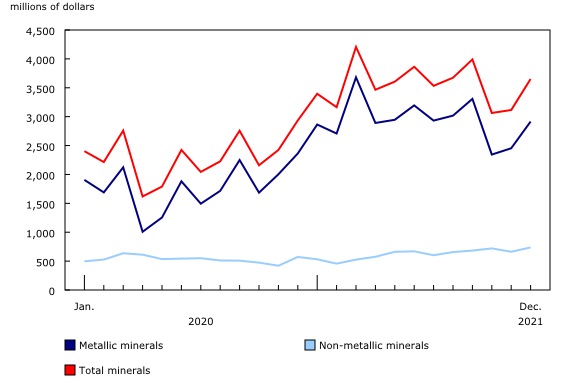
During the last quarter of 2021, the total value of shipments of minerals posted an overall decrease of 11.9% compared with the previous quarter, after experiencing a sharp drop during the month of October. While subsequent increases were reported in November and December, they were not enough to counter October's decrease. Lower shipment values for gold, iron ore and copper were mainly responsible for the decline.
The total value of minerals shipped declined 23.2% in October, compared with the previous month, to $3.06 billion, the lowest figure seen in 2021. This was attributable to decreases in shipment values of metallic minerals. In November, the total value of shipments grew slightly by 1.6% to $3.11 billion, mainly as a result of an increase in the value of shipments of metallic minerals. In December, the value of minerals shipped rose for a second consecutive month, recording a 17.3% increase to $3.65 billion.
Compared with the same period in 2020, the total value of shipments of minerals increased 30.8% in the fourth quarter of 2021.
Shipment values of metallic minerals drop sharply in October
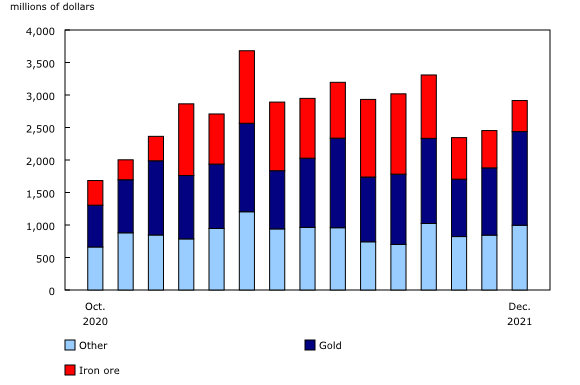
The value of metallic minerals shipped decreased 29.1% to $2.34 billion in October. While the value of shipments of zinc increased 66.7% in October, decreases in the majority of commodities, including iron ore (-34.5%), copper (-33.9%) and gold (-32.6%), were responsible for the overall decline observed in the value of metallic minerals shipped in the month. The growth registered in November's shipment values (+4.6%) was attributable to multiple commodities, including nickel (+26.9%) and gold (+17.2%). December's increase in shipment values (+18.8%) can be credited to the rebound of copper (+42.0%), gold (+39.2%) and silver (+22.1%).
Overall, the value of metallic mineral shipments in the fourth quarter of 2021 increased 27.5% compared with the same quarter in 2020.
Copper production displays a downward trend in the fourth quarter
After posting a slight increase in the third quarter of 2021, copper production displayed a downward trend in the fourth quarter. In October, copper production was down 8.0%, followed by two consecutive monthly declines (-3.2% in November and -5.5% in December). Conversely, nickel production grew by 2.46 million kilograms during the three-month period, as a result of increased production reported in November (+35.5%). In addition, cobalt production was up by 83,279 kilograms in the fourth quarter, primarily as a result of a 32.2% gain reported in November.
The value of shipments of non-metallic minerals increases in the fourth quarter
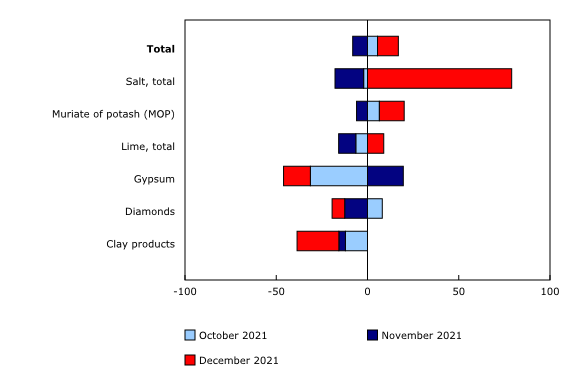
Shipment values of non-metallic minerals posted an increase in October (+5.5%), followed by a decrease in November (-8.1%) and another increase in December (+11.4%). October's growth in shipment values stemmed mainly from diamonds (+8.1%) and muriate of potash (+6.5%), which more than offset a drop in the value of shipments of gypsum (-31.3%) and lime (-6.4%). In November, the same commodities caused a decrease in non-metallic mineral shipment values, with a drop in the value of shipments of diamonds (-12.5%) and muriate of potash (-6.0%), along with salt, which was down 15.7%. Decreases registered for clay products (-3.6%) and lime (-9.4%) also played a role in November's drop in the value of shipments for non-metallic minerals. In December, the rise in non-metallic mineral shipment values resulted from a rebound in the value of muriate of potash (+13.6%) and salt (+79.0%). This increase was sufficient to more than offset the decreases in the value of shipments of clay products (-22.9%), gypsum (-14.7%) and diamonds (-6.9%) posted during the month.
The value of shipments of non-metallic minerals experienced a 44.5% growth in the fourth quarter of 2021 compared with the same quarter in the previous year, when the effects of the COVID-19 pandemic were prominent.
Muriate of potash leads increase in the production of non-metallic minerals in the fourth quarter
The production of non-metallic minerals trended upward in the fourth quarter, up 13.5% in October, 4.9% in November and 2.3% in December. In October, muriate of potash production increased 15.5%, or 249 405 metric tonnes, as did salt production, which was up 16.7%, or 186 392 metric tonnes. In November, production of muriate of potash grew for a second consecutive month (+10.0%), while salt production increased slightly (+1.2%). In December, salt production declined (-8.6%), as enough salt had been accumulated earlier in the fall in preparation for winter. However, the gain posted for muriate of potash (+10.3%, or 210 995 metric tonnes) was sufficient to compensate for decreases noted in other non-metallic mineral products.
Note to readers
The Monthly Mineral Production Survey estimates the production, shipments and inventories of Canada's leading minerals. This survey covers several metallic minerals, including copper, gold, iron ore, lead, nickel, silver and zinc, as well as non-metallic minerals, including diamonds, gypsum, potash and salt.
The Monthly Survey of Smelters and Metal Refineries covers smelters and metal refineries for a variety of base metals, including copper, lead, nickel and zinc.
The Monthly Mineral Production Survey is conducted as part of the Integrated Business Statistics Program and the Minerals and Metals Production Statistics Program modernization initiative.
Data from the Monthly Mineral Production Survey and the Monthly Survey of Smelters and Metal Refineries are released every month, and a detailed review is released every three months, in the month ending the quarter.
Data are not seasonally adjusted.
Data for the previous two months are subject to revision based on late responses. Data for October and November 2021 have been revised with this release.
Data prior to 2020 can be found on the Production of Canada's Leading Minerals page of the Natural Resources Canada website.
The value of shipments facilitates comparisons between mineral commodities since the units of measure of quantities produced or shipped vary dramatically from one mineral to another (for example, iron in millions of tonnes versus diamonds in carats).
Contact information
For more information, or to enquire about the concepts, methods or data quality of this release, contact us (toll-free 1-800-263-1136; 514-283-8300; infostats@statcan.gc.ca) or Media Relations (statcan.mediahotline-ligneinfomedias.statcan@statcan.gc.ca).
- Date modified:


