Canada's large urban centres continue to grow and spread
Archived Content
Information identified as archived is provided for reference, research or recordkeeping purposes. It is not subject to the Government of Canada Web Standards and has not been altered or updated since it was archived. Please "contact us" to request a format other than those available.
Released: 2022-02-09
In 2021, nearly three in four Canadians (73.7%) lived in one of Canada's large urban centres, up from 73.2% five years earlier.
These large urban centres with a population of 100,000 or more people, referred to as census metropolitan areas (CMAs), accounted for most of Canada's population growth (+5.2%) from 2016 to 2021.
Canada continues to urbanize as large urban centres benefit most from new arrivals to the country. From 2016 to 2019, Canada welcomed a record high number of immigrants and more than 9 in 10 settled in CMAs.
There were six more CMAs in 2021 compared with five years earlier, another sign of the increasing urbanization of the country.
Rapid population growth in cities is increasing the need for infrastructure, transportation and services of all kinds—including front-line emergency services. Further urban spread also raises environmental concerns such as car-dependent cultures and encroachment on farmlands, wetlands and wildlife.
Using new 2021 Census data, today we look at how Canada's 41 large urban centres have evolved since 2016 and since the onset of the pandemic. For the first time, we focus on population changes within different areas located inside Canada's CMAs and see that population growth within our cities has not been uniform across their territory.
Most CMAs across Canada, big and small, are generally structured the same way. There is a downtown, usually characterized by a high concentration of apartments, condos, offices, shops, restaurants, theatres and bars. There is also an urban fringe, which often includes neighbourhoods of single family or town homes with a yard, low rise condos and apartments, occasionally interspersed by commercial or industrial zones. Various types of suburbs surround the downtown core and urban fringe, and depending on the size of the city, can stretch out anywhere from a ten minute drive to a thirty or more minute journey to the downtown (see text box What constitutes a downtown or a suburb?).
Although most CMAs take on the same basic form, each is unique in that they reflect the character of the Canadians who live there. Location within Canada and home prices are also important considerations, as are the economic, social, health and education benefits afforded to those who choose to live there.
Note about the PDF version of this release: due to formatting issues, the PDF version of this release may display some blank pages. Rest assured that the content is not compromised. The HTML version provides optimal viewing.
Highlights
Nearly three in four Canadians (73.7%) lived in one of Canada's large urban centres in 2021, up from 73.2% five years earlier.
Downtowns are growing fast, and more rapidly than before. From 2016 to 2021, the downtown populations of the large urban centres grew faster (+10.9%) than the urban centres as a whole (+6.1%). The populations of downtowns also grew at over twice the pace compared with the previous census cycle (+4.6%).
At the same time, urban spread continued, and was accelerating in many CMAs. Overall, suburbs farthest from downtowns were generally growing at a faster pace (+8.8%) than the urban fringe (+3.7%) and suburbs closer to downtowns (+5.8%).
In the spring of 2021, 3.5% of Canadians (1,281,474 people) were living in the downtowns of one of the 41 large urban centres of the country. The most populated downtowns were Toronto (275,931 people), Vancouver (121,932 people), Montréal (109,509 people), Ottawa (67,169 people) and Edmonton (55,387 people).
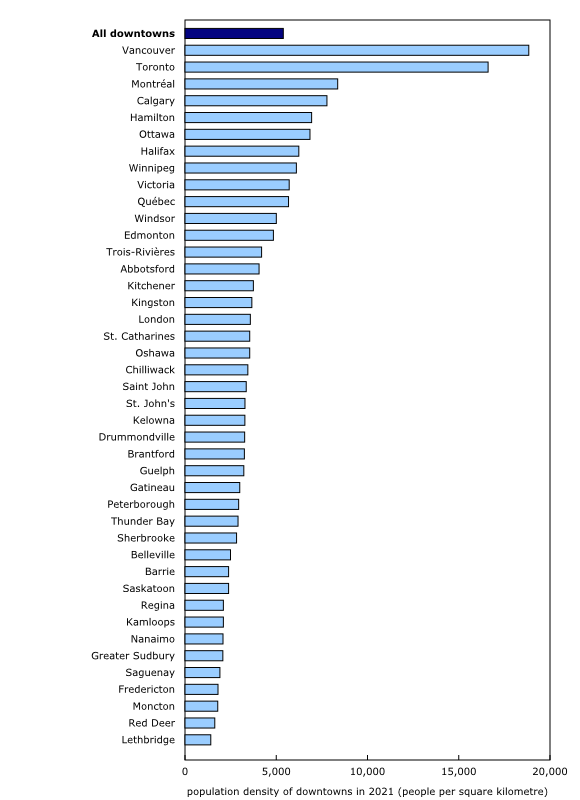
Vancouver (18,837 inhabitants per square kilometre) has the most densely populated downtown.
The downtown of Halifax grew at the fastest pace (+26.1%) from 2016 to 2021. In several of Canada's largest urban centres, the downtowns also showed very robust population growth, namely in Montréal (+24.2%), Calgary (+21.0%) and Toronto (+16.1%).
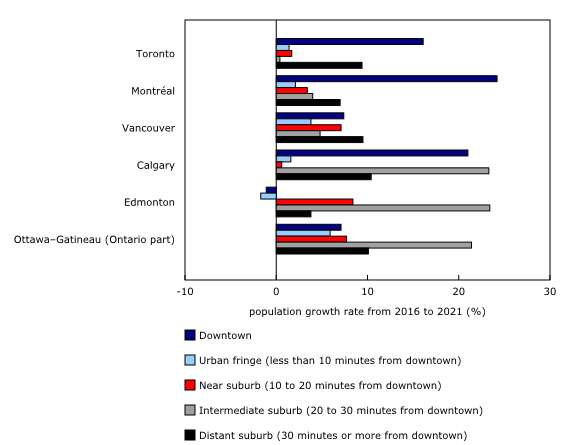
In Canada's three largest urban centres, the distant suburbs (30 minutes or more from downtown) grew at a faster pace than the urban fringe and suburbs closer to downtown, further evidence of the ongoing urban spread.
Urban spread also occurred in the intermediate suburbs (20 to 30 minutes from downtown) in Edmonton (+23.4%), Calgary (+23.3%) and Ottawa (+21.4%). The growth in these intermediate suburbs largely surpassed that of their respective downtowns, urban fringes and near suburbs.
The COVID-19 pandemic ended the rapid population growth that occurred in Canada's downtowns from 2016 to 2019.
There were fewer people living in the downtowns of Montréal (-3.1%) and Vancouver (-2.9%) on July 1, 2021, compared with the same day a year earlier. This contrasts with the census period as a whole, with the downtown population of Montréal growing on average by 4.8% a year from 2016 to 2021, while in Vancouver, the downtown population grew by 1.5% a year on average.
Population growth also slowed in the suburbs with the onset of the pandemic, albeit to a lesser extent than in downtowns.
The downtowns in Canada's large urban centres are growing rapidly while urban spread continues
Two concurrent phenomena are changing the face of most of Canada's large urban centres.
The population of the vast majority of downtowns is growing faster than before, while urban spread also continues and in some large urban centres is accelerating.
While the population of neighbourhoods between the downtown and the most distant suburbs are also rising, they are growing at a much slower pace.
What constitutes a downtown or a suburb?
A census metropolitan area (CMA) is a large urban centre with 100,000 or more people.
Downtowns are located in the central core of a CMA and all other areas can be characterized by their proximity to the downtown.
Downtowns have been defined based on job density, and their boundaries have been the subject of extensive consultations with municipalities across the country, along with other experts and urban planners. For more information on the methods used to determine the boundaries of downtowns, see Defining Canada's Downtown Neighbourhoods: 2016 Boundaries.
Every CMA has a primary downtown, located in the historic central municipality within the CMA. Thus, the downtown of the Toronto CMA is located within the municipality of Toronto.
Secondary downtowns have also been defined based on job density and on population counts in certain other municipalities within the CMA. For example, the municipality of Mississauga, which is part of the Toronto CMA, has a downtown that is referred to as secondary for the Toronto CMA overall, given that the primary downtown for the CMA is in the central municipality of Toronto.
This analysis is limited to primary downtowns. The term "downtown" is used to refer to the primary downtowns of the CMAs. Data related to secondary downtowns are available in the tables at the end of this release.
For this analysis, areas outside of the downtown in CMAs can be broken down into four separate zones characterized by the time it takes for a person to drive to the downtown by car.
An urban fringe is located less than a 10 minute drive from downtown.
A near suburb is located within 10 to 20 minutes from downtown.
An intermediate suburb is located within 20 to 30 minutes from downtown.
A distant suburb is 30 minutes or more from downtown.
Each zone is defined by the travel time from the downtown to outlying census tracts (small, relatively stable geographic areas ranging from 2,500 to 8,000 people), based on the time it takes to drive from downtown during non-rush hours.
Travel time by car is more reflective of reality than distance in kilometres between an outlying neighbourhood and a downtown given geographic or structural obstacles that could be encountered along the way such as rivers, ravines or railway tracks that may slow or block access to the downtown.
While there are 41 CMAs in Canada, we include 42 downtowns in this study to differentiate between the Ontario and Quebec parts of Ottawa–Gatineau.
Downtowns are growing faster than five years ago
Overall, the populations of downtowns grew at over twice the pace from 2016 to 2021 (+10.9%) compared with the previous five-year period (+4.6%), despite a slowdown since the onset of the pandemic in the spring of 2020.
Most downtowns (36 of 42) saw their population rise from 2016 to 2021. Most also saw their pace of population growth accelerate (33 of 42) compared with the previous census cycle from 2011 to 2016.
The population of downtowns (+10.9%) also rose at a faster pace compared with the population of CMAs overall (+6.1%). In other words, urban centres—particularly downtowns—have become more densely populated since 2016.
This is a reversal of the trend from 2011 to 2016, when the population of downtowns (+4.6%) grew at a slower pace compared with CMAs as a whole (+6.2%).
Several downtowns in Canada's largest CMAs, those of one million people or more, were among the fastest growing from 2016 to 2021 (Montréal: +24.2%; Calgary: +21.0%; Toronto: +16.1%).
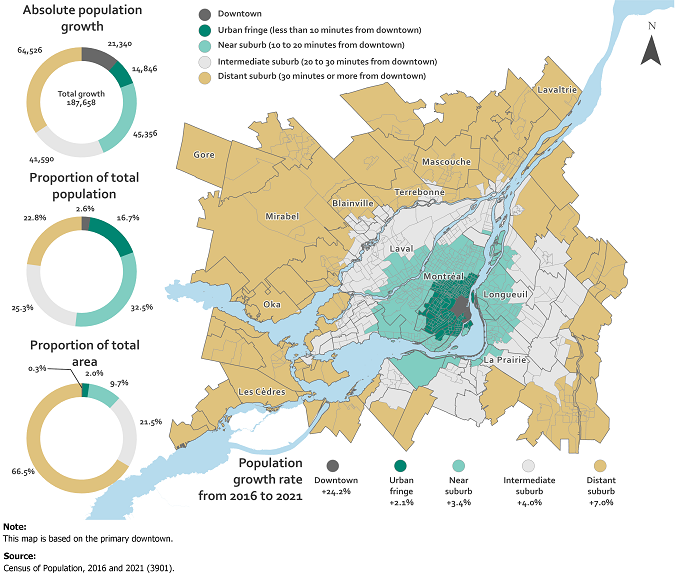
The downtown population of Halifax (+26.1%) grew almost three times faster compared with the entire Halifax CMA (+9.1%), while the downtown of Montréal (+24.2%) grew more than five times faster than the Montréal CMA (+4.6%).
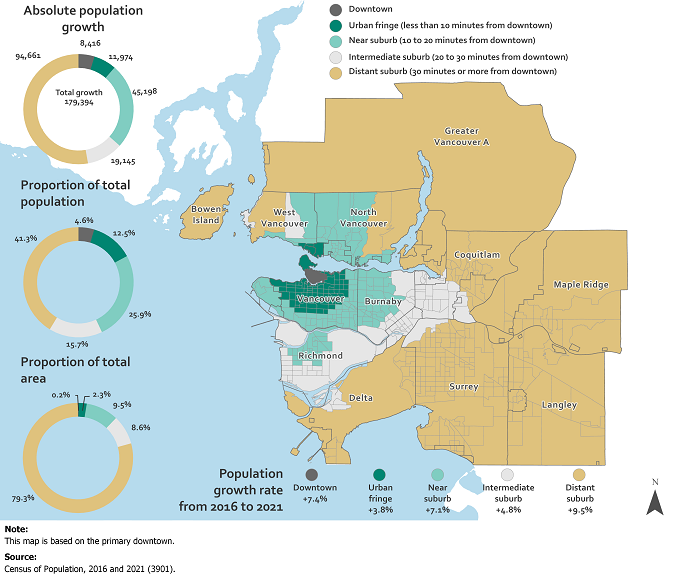
The populations of Canada's two largest downtowns—Toronto (+16.1%) and Vancouver (+7.4%)—also outpaced the growth rates of their CMAs (+4.6% in Toronto and +7.3% in Vancouver).
The recent acceleration of population growth in downtowns can be explained by various factors. On the one hand, administrations in several cities have adopted plans to increase the density and housing supply of downtowns. As well, the desire to live in central neighbourhoods remains strong, since many people want to minimize their commute times by living closer to work and to live in a dynamic area of their city that offers many nearby services and sources of entertainment.
Since the onset of the pandemic, the allure of downtown living may have lost some of its sheen with more people working from home and fewer opportunities to indulge in cultural or entertainment activities. Demographic estimates produced quarterly and annually by Statistics Canada will track whether population growth trends will shift over the coming years.
Urban spread continues in Canada's largest metropolitan areas
The populations of downtowns, urban fringes and near, intermediate and distant suburbs grew in most large urban centres from 2016 to 2021, but their pace of growth varied considerably.
For example, in Canada's three largest urban centres, the distant suburbs (30 minutes or more from downtown) grew at a faster pace than the urban fringe and suburbs closer to downtown. The population increases among the distant suburbs of Toronto (+9.4%), Montréal (+7.0%) and Vancouver (+9.5%) all surpassed those of their CMA overall.
In the CMA of Vancouver, the distant suburbs grew at the fastest pace from 2016 to 2021, while in Toronto and Montréal, the pace of growth in distant suburbs was surpassed only by that of their downtowns. In Toronto, close to three-quarters of the total population growth in the CMA stemmed from distant suburbs.
Urban spread was also occurring in the intermediate suburbs (20 to 30 minutes from downtown) in Edmonton (+23.4%), Calgary (+23.3%) and Ottawa (+21.4%). The growth in these intermediate suburbs largely surpassed that of their respective downtowns, urban fringes and near suburbs.
The sustained population growth in the intermediate and distant suburbs may be attributable to various factors, including limited space to build new housing close to downtown, the desire of some families to have a larger home or property, the lower cost of housing on the outskirts or wanting to be closer to nature.
Urban spread is also occurring in Canada's mid-sized CMAs, but unlike in the six largest urban centres, it is the near suburbs, located within a 10 to 20 minute drive from downtown, where population is growing at the fastest pace.
In these smaller metropolitan areas, more land is often still available for development close to the downtown.
In some suburbs, population growth may have been bolstered by the greater possibility of working from home during the pandemic. A recent study showed that approximately 40% of the jobs in Canada could feasibly be done at home. Indeed, in April 2020, during the first wave of the pandemic, about 40% of employees worked most of their hours from home, up from 4% in 2016. At the time of the census in May 2021, 5.1 million Canadians worked at least half of their usual hours from home.
Higher housing prices may also be a factor, with new home prices up 11.3% year over year nationally in May 2021, the largest increase since November 2006, and new home prices were 17.8% higher compared with 2016. Higher housing prices may have tempted Canadians to move to more distant suburbs, where larger houses could be available at a lower cost than closer to downtown.
In 2020 and 2021, the population of most of Canada's downtowns grew slower or declined in the wake of the pandemic
Since the onset of the pandemic in the spring of 2020, far fewer Canadians are commuting to work downtown as many businesses and government agencies that could do so shifted from an office setting to working virtually at home.
However, the much lower levels of commuter traffic downtown have not resulted in population declines of the same magnitude according to our most recent preliminary demographic estimates.
For example, from July 1, 2020 to the end of June 2021, the downtown population of Toronto (+0.4%) continued to grow, albeit at a much slower pace compared with the pace of growth seen from 2016 to 2021 overall (+3.2% annually). This may be related to housing supply, especially condominiums, where new units continued to come onto the market even after the onset of the pandemic. Some buyers who bought their home prior to the pandemic may only have taken possession in 2020 or 2021.
From July 1, 2020, to the end of June 2021, the pace of growth slowed in the vast majority of downtowns (38 of 42) compared with the years leading up to the pandemic (2016 to 2019). Moreover, the population declined in 30 of 42 downtowns from July 1, 2020 to the end of June 2021, albeit mostly by a slight margin.
For example, with the onset of the pandemic, the population declined in the downtowns of Canada's second and third largest urban centres. There were fewer people living in the downtowns of Montréal (-3.1%) and Vancouver (-2.9%) on July 1, 2021, compared with the same day a year earlier. This contrasts with the census period as a whole, with the downtown population of Montréal growing on average by 4.8% a year from 2016 to 2021, while in Vancouver, the downtown population grew by 1.5% a year on average.
Population growth also slowed in the suburbs in 2020 and 2021, one year into the pandemic
Preliminary demographic estimates show that the pace of population growth in the suburbs has also slowed since the start of the COVID-19 pandemic, albeit to a lesser extent than in downtowns.
For example, from July 1, 2020 to the end of June 2021, the population of the distant suburbs in the CMAs of Toronto (+1.8%) and Montréal (+0.7%) grew at a slightly slower pace compared with the annual averages from 2016 to 2021 (+1.9% for Toronto; +1.4% for Montréal).
There could be several reasons why the pandemic has had less of an impact on population growth in suburbs than in the downtowns. Some people who have worked at home since the start of the pandemic may have chosen to move out of the downtown to the suburbs in search of more space or a more affordable home.
Given that new arrivals to Canada are more likely to settle in the core of urban centres, border restrictions to slow the spread of COVID-19 may have had less impact on population growth in the distant suburbs but contributed more to slower growth downtown.
The downtowns of Vancouver and Toronto are by far the most densely populated in Canada
Approximately 3.5% of Canadians (1,281,474) were living in the downtowns of one of the 41 CMAs across the country in the spring of 2021.
The most populated downtowns were Toronto (275,931 people), Vancouver (121,932 people), Montréal (109,509 people), Ottawa (67,169 people) and Edmonton (55,387 people).
Since downtowns are often characterized by high-rise apartment buildings, these areas have among the highest population densities in the country.
The population density of all CMA downtowns combined totalled 5,385 people per square kilometre in 2021. Vancouver (18,837 inhabitants per square kilometre) had the most densely populated downtown, followed by Toronto (16,608 inhabitants per square kilometre).
By comparison, there were 28,668 people per square kilometre in Manhattan in 2020 (9.5 MB, in PDF format only), the densest borough in New York.
The vastness of Canada makes our overall population density among the lowest in the world, with four inhabitants per square kilometre. For the 41 CMAs in Canada combined, there are 226 people per square kilometre.
As you move further away from downtown, areas become less densely populated
Typically, neighbourhoods located further from downtown tend to be less densely populated.
Census results show that the distant suburbs (areas located 30 minutes or more from downtown by car) of Toronto and Vancouver had a population density of just under 500 people per square kilometre in May 2021. In Montréal, that figure was just over 300 people per square kilometre.
That density was even lower in Calgary, Edmonton and Ottawa, where there were fewer than 50 inhabitants per square kilometre in distant suburbs. This is mostly explained by the fact that, unlike Canada's three largest metropolitan areas, more land is still available for development.
Looking ahead: A deeper dive into the makeup of cities
The 2021 Census data to be released in the coming months will provide a better understanding of the diverse neighbourhoods of Canada's largest urban centres. Are there more seniors or young adults living downtown? Where are families with children concentrated? Which parts of town do single Canadians call home?
Data from the upcoming census releases will shed light on these questions and many, many more.
Did you know? Outside large urban centres, population is also increasing, although at a slower pace than urban Canada
To learn more about the total population and dwelling counts from the 2021 Census, check out the other analytical documents released today.
The Daily article entitled "Canada tops G7 growth despite COVID" presents key results at the national, provincial and territorial levels. It also presents some population trends for Canada's rural areas.
The Census in Brief article entitled "Population growth in Canada's rural areas, 2016 to 2021" presents a more detailed portrait of population growth inside Canada's rural areas.
The Census in Brief article entitled "Canada's fastest growing and decreasing municipalities from 2016 to 2021" examines municipalities (census subdivisions) in Canada that were the largest in 2021, and fastest growing and decreasing in population from 2016 to 2021. It also presents some trends on urban spread in Canada.
Note to readers
Canadians are encouraged to download the StatsCan app to view the census results.
Definitions, concepts and geography
The population growth rates reported in this document are calculated as the difference in population size between two dates (two censuses, for example), divided by the population of the earlier date, expressed as a percentage change.
All data and results presented in this document are based on the 2021 geographic boundaries.
According to the geographic boundaries of the 2021 Census, Canada now has 41 census metropolitan areas (CMAs) and 111 census agglomerations (CAs). Readers can consult the CMA and CA reference maps.
The six new CMAs are Fredericton (New Brunswick), Drummondville (Quebec), Red Deer (Alberta), Kamloops (British Columbia), Chilliwack (British Columbia) and Nanaimo (British Columbia).
In addition, the CMA of Ottawa–Gatineau was expanded to include the former CAs of Arnprior and Carleton Place. Similarly, the CMA of Windsor was expanded to include the former CA of Leamington.
Two former CAs from the 2016 Census ceased to be CAs in the 2021 Census: Bay Roberts (Newfoundland and Labrador) and Cold Lake (Alberta).
Five new CAs have been added since the 2016 Census: Sainte-Agathe-des-Monts (Quebec), Amos (Quebec), Essa (Ontario), Trail (British Columbia) and Ladysmith (British Columbia).
For detailed definitions of CMAs and CAs, please refer to the Census Dictionary.
2021 Census of Population products and releases
Today, Statistics Canada is releasing the first results from the 2021 Census of Population. These results focus on the growth in population and dwellings from 2016 to 2021 at the national, provincial and territorial levels, as well as for various subprovincial geographical levels.
Several 2021 Census products are also available today on the 2021 Census Program web module. This web module has been designed to provide easy access to census data, free of charge.
Analytical products include two articles in The Daily and two articles in the Census in Brief series.
Data products include the population and dwelling counts for a wide range of standard geographic areas, available through the Census Profile and Highlight tables.
Focus on Geography provides data and highlights on key topics found in this Daily release and in the Census in Brief articles at various levels of geography. In addition, a new data visualization, Ranking of the 10 most populated municipalities, 1901 to 2021, is now available.
Reference materials are designed to help users make the most of census data. They include the Guide to the Census of Population, 2021, the Dictionary, Census of Population, 2021, and the 2021 Census of Population questionnaires. Both the Dictionary and the Guide are updated with additional information throughout the release cycle.
Geography-related 2021 Census Program products and services can be found under Geography. This includes GeoSearch, an interactive mapping tool, and thematic maps, which show data for various standard geographic areas, along with the Focus on Geography and Census Program Data Viewer, which are data visualization tools.
Over the coming months, Statistics Canada will continue to release results from the 2021 Census of Population, and provide an even more comprehensive picture of the Canadian population. Please see the 2021 Census release schedule to find out when data and analysis on the different topics will be released throughout 2022.
Contact information
For more information, or to enquire about the concepts, methods or data quality of this release, contact us (toll-free 1-800-263-1136; 514-283-8300; infostats@statcan.gc.ca) or Media Relations (statcan.mediahotline-ligneinfomedias.statcan@statcan.gc.ca).
- Date modified:


