Trends in private and public funding in Canadian colleges, 2019/2020
Archived Content
Information identified as archived is provided for reference, research or recordkeeping purposes. It is not subject to the Government of Canada Web Standards and has not been altered or updated since it was archived. Please "contact us" to request a format other than those available.
Released: 2022-01-20
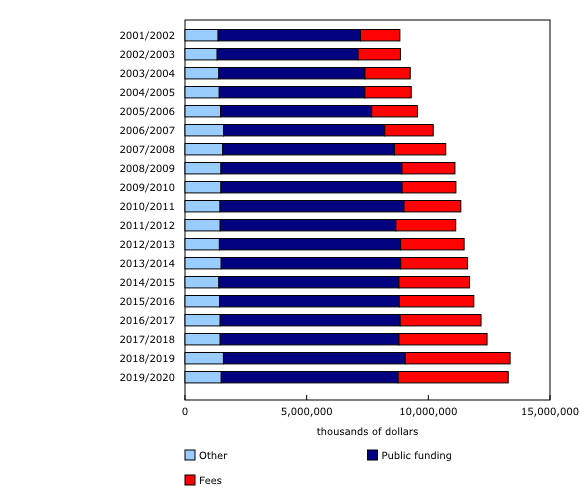
College revenues in Canada were $13.3 billion in 2019/2020. Since 2008/2009, revenues have remained relatively stable, increasing on average by 1.8% per year between 2008/2009 and 2019/2020, compared with an increase of 3.3% between 2001/2002 and 2007/2008. Public funding, although still the major source of revenue in most provinces, has declined steadily since 2008/2009, from 67.0% to 54.7% in 2019/2020. At the same time, the share of revenues from student fees increased from 19.6% in 2008/2009 to 34.1% in 2019/2020, which was driven mainly by the increase in enrolments of international students in colleges across the country.
Public funding is still the major source of funding in most Canadian provinces
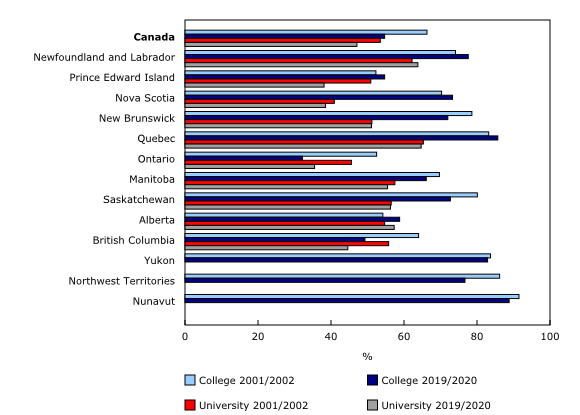
Nationally, public funding has declined as a proportion of total revenue for colleges, standing at 54.7% in 2019/2020, a higher proportion than for universities (47.1%). The overall decline in public funding has largely been driven by the increased reliance on student fees in Ontario and British Columbia. However, it remains the main source of funding in the rest of the provinces and territories. More than 7 in 10 dollars of total college revenue came from public funding in Nunavut (88.8%), Quebec (85.7%), Yukon (82.9%), Newfoundland and Labrador (77.6%), Northwest Territories (76.7%), Nova Scotia (73.3%), Saskatchewan (72.7%), and New Brunswick (72.0%) in 2019/2020.
Overall, public funding for colleges and universities is determined by provincial and territorial budgets, with each jurisdiction having its own funding models. At the institutional level, universities and colleges also receive operational grants based on past budgets, enrolments and special needs on a case-by-case basis.
Student fees make up a larger part of college revenues
While there has been little change in overall college revenues since 2008/2009, decreases in public funding have been offset by increases in student fees. Between 2008/2009 and 2019/2020, student fees doubled from $2.2 billion (19.6%) to $4.5 billion (34.1%), with an increasing share being paid by international students. Between 2009/2010 and 2019/2020, there was nearly a six-fold increase in the number of international students in colleges, from 23,175 (4.5%) to 132,048 (21.9%). The growth in the number of international students was most pronounced in Ontario and British Columbia (Postsecondary Student Information System, 2019).
In Ontario, student fees have replaced public funding as the main source of college revenue
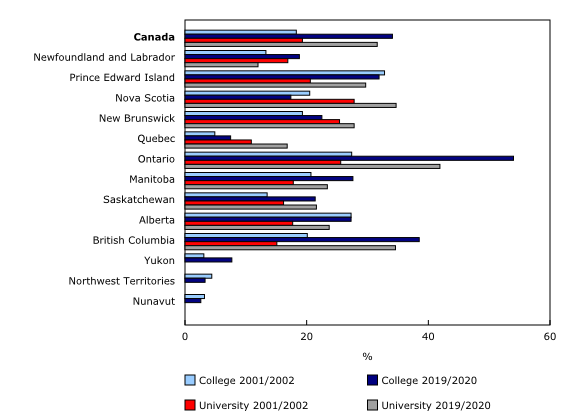
In Ontario, student fees accounted for over half (54.0%) of all college revenues in 2019/2020, while public funding decreased to 32.2%. In comparison, in 2008/2009, 28.2% of revenues in Ontario colleges came from student fees, while public funding accounted for over half (54.4%). This pattern was also observed in Ontario universities, where tuition fees were the main source of revenue in 2019/2020 (41.9%, compared with 35.5% from public funding). In 2008/2009, public funding made up the bulk of university revenue (53.7%), compared with tuition fees (29.9%).
While public funding was still the largest source of revenue for colleges in British Columbia in 2019/2020 (49.3%), this has declined since 2008/2009, when it accounted for almost two-thirds (63.8%) of total revenue. Over that period, the share of revenue from student fees increased from 25.1% in 2008/2009 to 38.5% in 2019/2020. Again, this pattern was similar for universities, where tuition fees accounted for 34.6% of revenues in 2019/2020, compared with 15.1% in 2008/2009.
Growth in Ontario and British Columbia student fees is mainly explained by increased enrolment of international students
Much of the revenue increase in Ontario and British Columbia colleges is attributable to the increased enrolment of international students over the last 10 years. There was a six-fold increase in the number of international college students in Ontario, which grew from 14,157 (7.1%) in 2009 to 88,542 (34.0%) in 2019. Over this same period, international student enrolment in British Columbia increased from 3,528 (8.7%) to 18,912 (35.5%). Although Ontario and British Columbia colleges together make up over one-third (43.7%) of all Canadian college students, they represented more than 8 in 10 (81.4%) international college students.
College student fees as a percentage of total revenue remained the lowest in Quebec and the territories
In Quebec, CEGEPs comprise a large part of the college system and do not directly charge student fees to Quebec residents, with administration fees also being minimal. As a result, in 2019/2020, although Quebec had the second-highest total college revenue at $3.3 billion, accounting for 24.6% of college revenue in Canada, it accounted for 5.4% of national revenue from student fees.
Quebec too has seen an increase in international students. While the overall college student population increased by 0.7% in the last decade, (from 189,589 in 2009 to 190,938 in 2019), it quadrupled for international students over the same period (from 2,454 to 9,921). Despite this increase, international college students represent a small share (5.2%) of the total college student population in Quebec.
This analysis is based on data collected before the COVID-19 pandemic. It remains to be seen how the pandemic has affected college finances, in particular, in provinces where international student fees are an important source of revenue. The next release of the Financial Information of Colleges will contain data that will show the potential impacts of the pandemic on colleges until the end of the 2021 fiscal year.
Note to readers
In the Financial Information of Colleges (FINCOL) survey, colleges refer to colleges, institutes, CEGEPs, and polytechnics.
Revenue data are collected from each college and are distributed by type of fund, including general operating funds (an unrestricted fund that accounts for the institution's primary activities of instruction and operations), sponsored research and capital.
All of the financial figures are in constant 2019/2020 dollars adjusted for inflation, unless otherwise noted.
Additional information for the 2019/2020 FINCOL survey is also available.
The FINCOL data are available upon request.
Contact information
For more information, or to enquire about the concepts, methods or data quality of this release, contact us (toll-free 1-800-263-1136; 514-283-8300; infostats@statcan.gc.ca) or Media Relations (statcan.mediahotline-ligneinfomedias.statcan@statcan.gc.ca).
- Date modified:


