National tourism indicators, third quarter 2021
Archived Content
Information identified as archived is provided for reference, research or recordkeeping purposes. It is not subject to the Government of Canada Web Standards and has not been altered or updated since it was archived. Please "contact us" to request a format other than those available.
Released: 2022-01-07
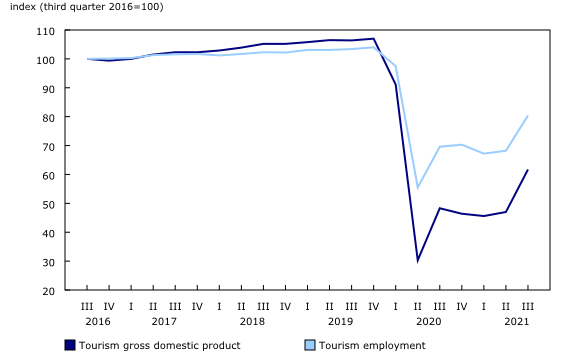
Tourism spending in Canada (+28.3%) rose in the third quarter following a 3.3% increase in the previous quarter. Tourism gross domestic product (GDP) (+31.1%) and employment attributable to tourism (+17.9%) also rose in the third quarter.
Growth in tourism-related activity occurred as pandemic restrictions eased throughout the third quarter and the number of people with two doses of an approved COVID-19 vaccine doubled from the beginning of July to the end of September. Fully vaccinated travellers from the United States were allowed entry into Canada for non-essential travel beginning on August 9, 2021, while the remainder of international discretionary travellers were allowed entry on September 7.
Passenger air transport (+156.0%) was the largest contributor to growth in tourism spending, accounting for nearly one-third of the growth in the quarter. Food and beverage services (+35.8%), accommodation (+27.0%) and recreation and entertainment (+69.3%) also contributed to growth in the third quarter. Despite the increases, tourism spending in Canada was 43.2% lower than the pre-pandemic levels seen in the fourth quarter of 2019.
Tourism GDP grew 31.1% in the third quarter, following a 3.1% increase in the second quarter. Transportation (+113.0%) and accommodation (+31.9%) were the greatest contributors to the rise in tourism GDP. Economy-wide GDP (+1.3%) grew at a slower pace, causing tourism's share of GDP to increase from 0.8% in the second quarter to 1.1% in the third quarter.
Employment attributable to tourism increased 17.9% in the third quarter, following a 1.5% increase in the previous quarter. The number of tourism jobs in food and beverage services (+27.8%), recreation and entertainment (+36.6%) and accommodation (+19.4%) contributed to the increase, while travel services declined 1.2%. Overall, total employment in Canada increased 3.0% in the third quarter, resulting in tourism's share of employment growing 0.4 percentage points to 2.8% in the third quarter.
Tourism spending in Canada by Canadians increases
Tourism spending in Canada by Canadians increased 21.2% in the third quarter, following a 4.4% increase in the previous quarter. Domestic spending on passenger air transport (+155.2%), food and beverage services (+29.7%) and recreation and entertainment (+62.3%) contributed most to the increase.
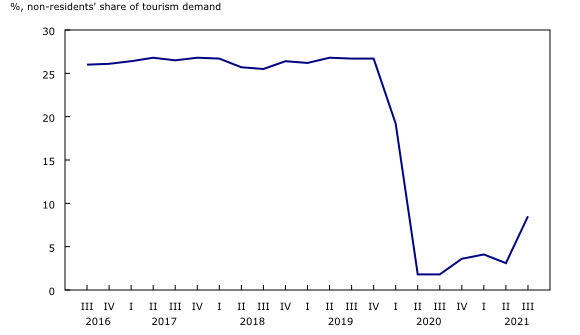
The share of domestic spending to total spending was 91.5% in the third quarter. Although 5.4 percentage points lower than the previous quarter, the share of domestic tourism spending still remains above the pre-pandemic share of 73.3% observed in the fourth quarter of 2019.
Spending by international visitors more than triples
Tourism spending by international visitors to Canada increased 247.3% in the third quarter, following a 20.8% decline in the second quarter. Fully vaccinated travellers from the United States were allowed entry as of August 9, 2021 (approximately halfway through the quarter), while the remainder of fully vaccinated international travellers were allowed entry as of September 7. Overnight travel from the United States increased sixfold, while overnight travel from countries other than the United States more than doubled. Despite the strong growth in the third quarter, spending by international visitors was 81.9% lower than pre-pandemic levels observed in the fourth quarter of 2019.
Sustainable development goals
On January 1, 2016, the world officially began implementing the 2030 Agenda for Sustainable Development, the United Nations' transformative plan of action that addresses urgent global challenges over the next 15 years. The plan is based on 17 specific sustainable development goals.
The national tourism indicators are an example of how Statistics Canada supports the reporting on the global goals for sustainable development. This release will be used in helping to measure the following goal:

Note to readers
Growth rates for tourism spending and gross domestic product (GDP) are expressed in real terms (that is, adjusted for price changes), using reference year 2012, and are adjusted for seasonal variations, unless otherwise indicated.
Employment data are also seasonally adjusted.
Tourism's share of economy-wide employment is calculated using seasonally adjusted values.
For information on seasonal adjustment, see Seasonally adjusted data – Frequently asked questions.
Associated percentage changes are presented at quarterly rates, unless otherwise noted.
Economy-wide GDP is obtained from table 36-10-0104-01. Economy-wide employment is obtained from table 36-10-0207-01. Overnight travel is obtained from table 24-10-0043-01.
Non-tourism industries, also referred to as other industries, are industries that would continue to exist in the absence of tourism. For example, the crop production and petroleum refineries industries produce products purchased by tourists. However, neither industry would cease to exist in the absence of tourism. Tourism GDP takes into account the production of these products purchased by tourists.
Non-tourism products, also referred to as other products, are products for which a significant part of its total demand in Canada does not come from visitors, such as groceries, clothing and alcohol bought in stores.
With the third quarter 2021 release of the national tourism indicators, all data from the first and second quarters have been revised.
Revisions over the 2020 to 2021 period are expected to be higher than normal because of the volatile economic situation, particularly for the tourism sector.
The national tourism indicators are funded by Destination Canada.
Next release
Data on the national tourism indicators for the fourth quarter of 2021 will be released on March 30, 2022.
Products
The data visualization product "Provincial and Territorial Tourism Satellite Account," which is part of Statistics Canada – Data Visualization Products (71-607-X), is available.
The Economic Accounts Statistics portal, accessible from the Subjects module of the Statistics Canada website, features an up-to-date portrait of national and provincial economies and their structure.
The Latest Developments in the Canadian Economic Accounts (13-605-X) is available.
The User Guide: Canadian System of Macroeconomic Accounts (13-606-G) is available.
The Methodological Guide: Canadian System of Macroeconomic Accounts (13-607-X) is available.
Contact information
For more information, or to enquire about the concepts, methods or data quality of this release, contact us (toll-free 1-800-263-1136; 514-283-8300; infostats@statcan.gc.ca) or Media Relations (statcan.mediahotline-ligneinfomedias.statcan@statcan.gc.ca).
- Date modified:


