Environmental and Clean Technology Products Economic Account, 2020
Archived Content
Information identified as archived is provided for reference, research or recordkeeping purposes. It is not subject to the Government of Canada Web Standards and has not been altered or updated since it was archived. Please "contact us" to request a format other than those available.
Released: 2022-01-06
The real gross domestic product (GDP) generated by the environmental and clean technology products sector declined 5.6% from 2019 to 2020. It's one of the rare declines since the beginning of the series in 2007. The real GDP of the total Canadian economy declined at a similar same pace in 2020 (-5.2%).
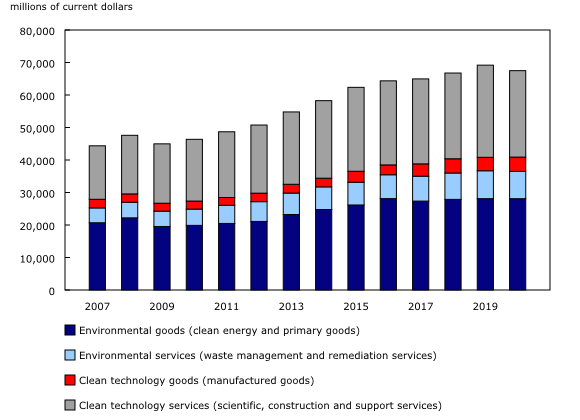
In nominal terms, the value of the environmental and clean technology products sector in Canada declined to $67.5 billion in 2020, accounting for 3.3% of Canadian GDP. The share of the environmental and clean technology products GDP out of total GDP has remained relatively stable since the beginning of the time series in 2007.
The shares of the three main contributors to the sector—the provinces of Ontario, Quebec and British Columbia— have also remained stable. In 2020, Ontario (34.3%) accounted for over one-third of the total value of environmental and clean technology products, while Quebec (28.8%) accounted for over one-quarter and British Columbia (15.3%) for one-seventh.
As in 2019, just over half (54.1%) of the national GDP from the environmental and clean technology products sector was attributable to the production of environmental goods and services. The remaining 45.9% of national GDP from the sector was attributable to the production of clean technology goods and services.
The Environmental and Clean Technology Products Economic Account measures the contribution to the Canadian economy of goods and services that reduce environmental impacts. Two broad categories of goods and services are recognized: environmental goods and services (including clean electricity from renewable sources and nuclear power generation, biofuels and primary goods, and waste management and remediation services), and clean technology goods and services (including manufactured goods, scientific and research and development services, construction services, and support services). Examples of clean technology goods and services include solar panels and the design and construction of energy-efficient buildings.
Declines in the gross domestic product of the environmental and clean technology products sector driven by clean technology services
Overall, the drop in national real GDP for the environmental and clean technology sector in 2020 was driven by the clean technology services category. In particular, the drop reflected declines in scientific and research and development services (-11.4%) as well as construction services (-10.6%). The generation of clean electricity, which is a significant contributor to the sector's GDP, saw its GDP decrease by 2.0% from 2019.
Most environmental and clean technology product exports and imports are manufactured goods
Volumes of environmental and clean technology product exports increased 6.7% from 2019 to 2020. In nominal terms, the value of these exports totalled $14.3 billion in 2020, amounting to 2.2% of total Canadian exports. By way of comparison, pharmaceutical and medicinal products exports accounted for 1.9% of total exports that same year.
As in 2019, more than three-quarters (76.8%) of all environmental and clean technology product exports were clean technology products (mostly manufactured goods) in 2020. Clean electricity exports accounted for 16.3% of the value of environmental and clean technology products exported. Volumes of clean technology services exports declined 7.6% in 2020.
National environmental and clean technology products import volumes dropped 3.7% in 2020, after increasing 4.5% in 2019. This may reflect the impact of the pandemic on businesses, including less activity at industrial facilities during the first wave of the pandemic as well as the disruptions to worldwide supply chains.
The total value of Canadian environmental and clean technology product imports (in nominal terms) accounted for 3.0% or $20.5 billion of total Canadian imports in 2020.
Manufactured goods accounted for 70.3% of that total at $14.4 billion.
Employment decreases but salaries increase
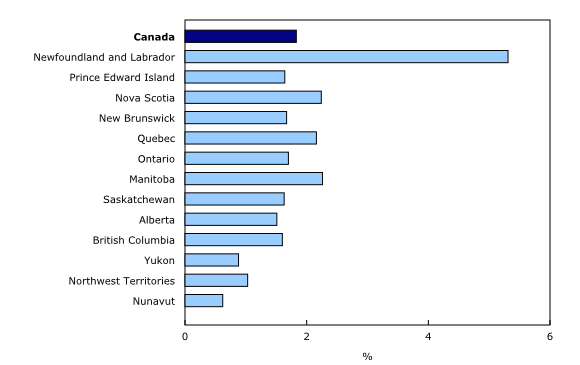
An estimated 322,972 jobs were attributable to total environmental and clean technology activity in 2020, down 4.6% from a year earlier and accounting for 1.8% of all jobs in Canada in 2020. For the same period, total Canadian job numbers declined 9.4%.
Of these 322,972 jobs attributed to the environmental and clean technology sector, 203,141 jobs were dedicated to the production and delivery of clean technology goods and services. The remaining 119,831 jobs were related to the production and delivery of environmental goods and services.
The engineering construction industry was the largest industry group, accounting for over one-fifth or 68,392 environmental and clean technology jobs in 2020. Three-fifths (63.0%) of these jobs were in the electric power engineering industry.
This was followed closely by the utilities industry at 67,318, or 20.8% of environmental and clean technology jobs. These jobs were predominately found in electric power generation, transmission and distribution industry.
Ontario (36.2%), Quebec (26.3%), and British Columbia (11.5%) continued to employ the majority of environmental and clean technology sector workers in 2020.
The national average annual compensation per environmental and clean technology job, including benefits, rose 6.4% from a year earlier to $96,281 in 2020 compared with an economy-wide average of $68,752 (up 8.2% from 2019).
Note to readers
The Environmental and Clean Technology Products Economic Account (ECTPEA) measures the economic contribution of environmental and clean technology products in terms of output, GDP, employment (number of jobs) and other economic variables. Estimates are directly comparable with national results for the Canadian economy. Estimates of GDP referred to in this release are measured at basic prices.
Estimates for 2019 and 2020 are preliminary and will be revised when updated data become available, including the supply and use tables for those reference years. Estimates were revised for the years 2016 and 2017 to reflect the revision of input data like the Canadian Productivity Account.
Environmental and clean technology products are defined as any process, product or service that reduces environmental impacts through any of the following three strategies: environmental protection activities that prevent, reduce or eliminate pollution or any other degradation of the environment; resource management activities that result in the more efficient use of natural resources, thus safeguarding against their depletion; or the use of goods that have been adapted to be significantly less energy or resource intensive than the industry standard.
Two broad categories of environmental and clean technology products are exported: environmental goods and services (including clean electricity, biofuels and primary goods, and waste management and remediation services), and clean technology goods and services (including manufactured goods, scientific and research and development services, construction services, and support services). The products follow the Supply and Use Product Classification used in the Canadian System of Macroeconomic Accounts.
As part of the Government of Canada's initiative to develop the Clean Technology Data Strategy, the ECTPEA provides comprehensive measures of the supply and use of environmental and clean technology products in the Canadian economy. The ECTPEA has a broader scope than the Survey of Environmental Goods and Services because it captures all economy-wide transactions in the environmental and clean technology products sector, including elements such as clean energy and scrap goods. The government and non-profit sectors are also fully covered in the ECTPEA.
The compilation of the ECTPEA draws on a variety of data sources, including Statistics Canada's supply and use tables, detailed import and export statistics released in Canada's balance of international payments, and the Survey of Environmental Goods and Services.
Examples of environmental goods and services and clean technologies are available in the publication Clean technologies and the Survey of Environmental Goods and Services: A technical reference guide (16-511-X).
Contact information
For more information, or to enquire about the concepts, methods or data quality of this release, contact us (toll-free 1-800-263-1136; 514-283-8300; STATCAN.infostats-infostats.STATCAN@canada.ca) or Media Relations (613-951-4636; STATCAN.mediahotline-ligneinfomedias.STATCAN@canada.ca).
- Date modified:


