Job vacancies, third quarter 2021
Archived Content
Information identified as archived is provided for reference, research or recordkeeping purposes. It is not subject to the Government of Canada Web Standards and has not been altered or updated since it was archived. Please "contact us" to request a format other than those available.
Released: 2021-12-20
The number of job vacancies in Canada reached an all-time high of 912,600 in the third quarter of 2021, as employers and workers continued to adjust to easing public health restrictions and rapidly evolving economic conditions. Like other economies recovering from the labour market impacts of the COVID-19 pandemic, record-high job vacancies coincided with growth in overall employment and falling unemployment.
Quarterly data from the Job Vacancy and Wage Survey (JVWS) shed light on some of the factors behind the monthly job vacancy data released previously, including sectoral and regional differences in unmet labour demand, changes in the occupation and skills profile of vacancies, and recent trends in the wages offered by employers.
Job vacancies increase in all provinces and almost all sectors
Across all sectors, the total number of job vacancies reached an all-time high of 912,600 in the third quarter of 2021, more than 349,700 (+62.1%) higher than in the corresponding period in 2019. The job vacancy rate—number of job vacancies as a proportion of labour demand (occupied positions and vacant positions)—was 5.4%, also a record high and 2.1 percentage points higher than in the third quarter of 2019 (3.3%).
Compared with the same period two years earlier, job vacancies were up in all provinces in the third quarter of 2021. Proportionally, the largest increases were in Saskatchewan (+82.7%; +9,200), Quebec (+73.1%; +100,500) and Ontario (+64.5%; +132,900), while Nova Scotia (+35.2%; +4,700) had the smallest increase.
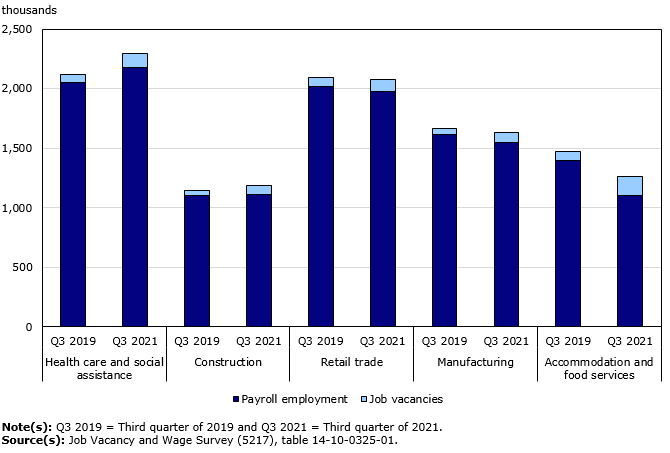
Job vacancies increased between the third quarter of 2019 and the third quarter of 2021 in 18 of the 20 major industrial sectors. Five sectors accounted for two-thirds (67.6%) of the increase: accommodation and food services (+86,400; +112.8%), health care and social assistance (+52,100; +78.8%), construction (+34,300; +83.7%), retail trade (+32,400; +45.2%), and manufacturing (+31,200; +62.4%).
Agriculture, forestry, fishing and hunting, and real estate and rental and leasing were the only sectors where vacancies were not up in the third quarter compared with the same period two years earlier.
Five sectors driving growth in job vacancies
Five sectors—health care, construction, accommodation and food, retail trade and manufacturing—were driving the growth in job vacancies. Increases in job vacancies can signal a number of changes in labour market conditions existing in different sectors and regions.
In the health care and social assistance sector, job vacancies (118,200) were up in the third quarter, while payroll employment from the Survey of Employment, Payrolls, and Hours had reached its pre-COVID level in December 2020, indicating that this sector was facing challenges including unmet labour demand in the context of increasing economic activity. Prior to the unprecedented demands placed on the health care system by the pandemic, employment in the sector had been increasing steadily since the third quarter of 2017, partly the result of an aging population. Nurse aides, orderlies and patient service associates (24,100) as well as registered nurses and registered psychiatric nurses (22,800) in the third quarter were among the occupations with the most vacancies.
Job vacancies in health care and social assistance increased in the third quarter compared with the same period two years earlier in all provinces, with the exception of Nova Scotia. The largest percentage increases were in Quebec (+117.4%; +20,100), Saskatchewan (+95.0%; +1,200), and British Columbia (+87.4%; +8,100).
In construction, job vacancies increased between the third quarters of 2019 and 2021, while payroll employment was little changed, suggesting that increased vacancies were due in part to labour market imbalances such as shortages of specific skills or geographic mismatches between vacant positions and the workers available to fill them. Within the sector, the largest two-year increases were recorded in the economic regions of Lower Mainland-Southwest in British Columbia (+5,600) and Toronto (+4,100).
In each of the three other sectors driving the increases in job vacancies—accommodation and food services, retail trade, and manufacturing—payroll employment was lower in the third quarter of 2021 than in the same period two years earlier. This suggests that businesses were working to fill vacant positions as they re-opened or as operations resumed during the third quarter of 2021.
Job vacancies in accommodation and food services accounted for one-quarter (24.7%) of the two-year increase in overall vacancies. The elevated level of vacancies in summer 2021 was likely due to several factors, including staffing challenges associated with the reopening of business in the sector and normal seasonal patterns, as labour demand in the sector typically peaks during the summer.
Active listening and critical thinking skills remain important to most job vacancies
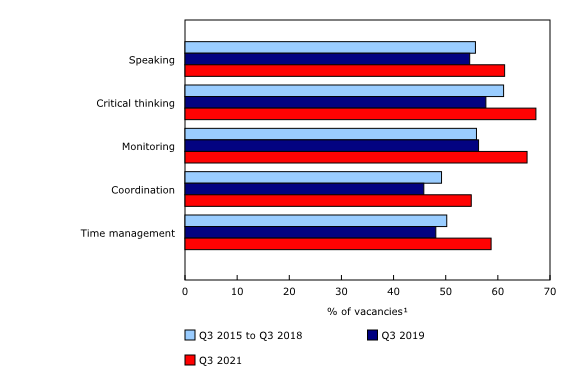
Employers look for specific skills, such as critical thinking and active learning, complex problem solving, and technical skills, to fill their vacancies. In the third quarter of 2021, active listening skills were important to more than 8 in 10 (83.9%) vacant jobs. Other skills important in more than half of vacancies included speaking (73.5%), critical thinking (69.0%), reading comprehension (60.8%), social perceptiveness (52.4%) and time management (51.5%).
Changes in the occupations and the skills associated with vacant positions have implications for the ability of employers to fill the vacancies. While the overall importance of these skills in the third quarter of 2021 was similar to the same period two years earlier, demand for certain skills has shifted in some sectors and regions. In the construction sector in British Columbia, for example, vacant positions were more likely to require time management, monitoring and critical thinking skills in the third quarter of 2021 than the same period two years earlier. This shift was the result of changes in the composition of job vacancies by occupation. For example, while the overall number of job vacancies in construction in British Columbia increased by over 80% (+7,800) over two years, vacancies for carpenters increased 148.6% (+1,900), while openings for construction trades helpers and labourers increased at a lower rate (+60.9%, +1,800) than vacancies in construction as a whole.
As demand for skills shifts, the ability of employers to find workers to fill vacant positions is influenced by a number of factors, including the extent to which positions require specialized skills. Of the 495 occupations included in the National Occupation Classification (NOC) for which skills profiles are available, 226 require at least one specific technical skill for the performance of the job. For example, computer programmers and interactive media developers require technical skills related to programming and operations analysis, while electricians require technical skills related to troubleshooting, repairing and quality control analysis. Vacancies in the 226 occupations combined were up 56.7% to 242,200 in the third quarter of 2021 compared with the same period two years earlier, and they accounted for 25.1% of the total two-year increase in job vacancies.
In contrast to occupations requiring specific technical skills, 40 occupations in the NOC require no technical skills and five or fewer non-technical skills. Vacancies in these occupations—which include food counter attendants, kitchen helpers and related support, construction trades helpers and labourers, and light-duty cleaners—increased by 73.7% to 234,600 on a two-year basis in the third quarter of 2021, and accounted for 28.5% of the all-industries two-year increase.
Vacancies increase more in low-wage occupations
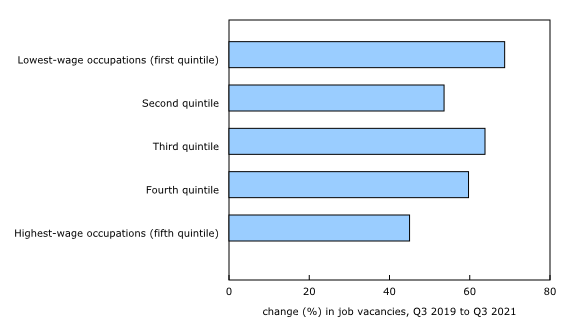
Vacancies increased more in low-wage occupations than in high-wage occupations between the third quarter of 2019 and the third quarter of 2021. In the third quarter of 2019, the 20% of occupations with lowest average wages (the first quintile of occupations ranked by 2019 third quarter Labour Force Survey [LFS] average wages) accounted for 35.0% of employees and 48.9% of job vacancies. In the third quarter of 2021, these same occupations represented 32.3% of employees and 50.9% of vacancies. In contrast, the 20% of occupations with the highest average wages (the fifth quintile of occupations ranked by 2019 third quarter LFS average wages) represented 9.4% of vacancies in the third quarter of 2021, down 1.1 percentage points from the same period two years earlier.
Growth in offered wages surpasses Consumer Price Index growth in more than half of occupations
The record-high job vacancies observed in recent months has focused attention on the extent to which unmet labour demand will contribute to upward pressure on wages. JVWS results complement LFS results by shedding light on offered wages, or the hourly wage associated with vacant positions.
Between the third quarters of 2019 and 2021, the Consumer Price Index (CPI) increased by 4.3%. Growth in average offered wages exceeded CPI growth over the same period in 155 of the 373 occupations in the NOC for which offered wages were available for both quarters. Among these occupations, those which had the largest increases in job vacancies included construction trades helpers and labourers, cooks, retail salespersons, and nurse aides, orderlies and patient service associates. The average offered wage increased 9.7% for these occupations, while the average hourly wages of all employees in the same occupations increased by 8.4% over the same period, based on LFS data. This is consistent with November LFS results, which showed that two-year growth in hourly wages was greater for new employees (+10.0%) than for established employees (+6.4%).
Average offered wage growth was lower for higher-skill occupations than for lower-skill occupations between the third quarters of 2019 and 2021. On average, offered hourly wages for the 226 occupations involving at least one technical skill increased 8.3% (+$2.00 to $26.00). In comparison, the equivalent increase for the 40 occupations requiring no technical skills and five or fewer non-technical skills was 10.0% (+$1.55 to $16.95).
In health care and other sectors offered wages vary by occupation
At the sector level, changes in offered wages reflect a mix of factors, including the balance between employment and vacancies, as well as the composition of vacancies by occupation.
In health care and social assistance, the average offered hourly wage for all vacant positions rose 4.9% (+$1.15 to $24.75) between the third quarter of 2019 and the third quarter of 2021. There were increases of 8.6% (+$1.60 to $20.25) among assisting occupations in support of health services and 2.8% (+$0.85 to $31.65) among professional occupations in nursing in this sector. The average offered hourly wage remained virtually unchanged among technical occupations in health (+$0.45 to $28.00) and was down 11.0% among professional occupations in health excluding nursing (-$4.65 to $37.30). These occupational groups accounted for 62.7% of the increase in vacancies within the health care and social assistance sector over the two-year period.
Over the same period, in the accommodation and food services sector, the average offered hourly wage for all vacancies rose 6.6% (+$0.95 to $15.30), including increases of 7.6% (+$1.05 to $14.85) among service support and other service occupations, 7.2% (+$1.15 to $16.85) among service supervisors and specialized service occupations, and 5.8% (+$0.75 to $13.90) among service representatives and other customer and personal services in this sector. These occupational groups accounted for 91.8% of the increase in job vacancies within accommodation and food services sector over the period.
Looking ahead
Since the end of the third quarter of 2021, the LFS has recorded improving labour market conditions. In October and November, total employment increased by a combined 185,000 (+1.0%), while the unemployment rate fell to 6.0% and was within 0.3 percentage points of its pre-COVID-19 February 2020 level (5.7%).
Statistics Canada will continue to monitor the level of unmet labour demand through monthly JVWS results. October 2021 results will be released on December 23, 2021. Detailed information for the fourth quarter of 2021, including information on the occupational and skills profile of vacancies, and changes in offered wages, will be released on March 22, 2022.
Note to readers
The Job Vacancy and Wage Survey (JVWS) provides comprehensive data on job vacancies and offered wages by industrial sector and detailed occupation for Canada and the provinces, territories and economic regions. Job vacancy and offered wage data are released quarterly.
Estimates by sector are based on the North American Industry Classification System 2017 Version 3.0. Estimates by geographical area are based on the Standard Geographical Classification 2016. Estimates by occupation reflect the National Occupational Classification (NOC) 2016 Version 1.3. The NOC is a four-tiered hierarchical structure of occupational groups with successive levels of disaggregation. The structure is as follows: (1) 10 broad occupational categories, also referred to as one-digit NOC; (2) 40 major groups, also referred to as two-digit NOC; (3) 140 minor groups, also referred to as three-digit NOC; and (4) 500 unit groups, also referred to as four-digit NOC.
Because of the COVID-19 pandemic, data collection for the JVWS was suspended for the second and third quarters of 2020.
In January 2020, a new electronic questionnaire was introduced. Minor changes to the content are documented in the most recent Guide to the Job Vacancy and Wage Survey (75-514-G).
Beginning with the reference period of October 2020, preliminary monthly estimates from the JVWS are released on a monthly basis alongside the Survey of Employment, Payrolls and Hours release. These estimates provide information on the number of job vacancies and the job vacancy rate by province and by industrial sector.
The target population of the survey includes all business locations in Canada, excluding those involved primarily in religious organizations and private households. Federal, provincial and territorial, as well as international and other extra-territorial public administrations are also excluded from the survey.
JVWS data are not seasonally adjusted. Therefore, quarter-to-quarter comparisons should be interpreted with caution as they may reflect seasonal movements.
This analysis focuses on differences between estimates that are statistically significant at the 68% confidence level.
Occupation quintiles by average wage and related employment figures are based on the Labour Force Survey.
Skills data was derived for occupations at the four-digit National Occupation Classification (NOC) level using occupational skill ratings obtained from the Occupational Information Network (O*NET), a free U.S. online database. A crosswalk was developed to convert the O*NET data to the NOC 2016, version 1.3.
For more information on the O*NET 26.0 Database by the U.S. Department of Labor, Employment and Training Administration (USDOL/ETA), please consult O*NET Resource Centre. Used under the CC BY 4.0 license. O*NET® is a trademark of USDOL/ETA.
Next release
Data on job vacancies from the JVWS for the fourth quarter of 2021 will be released on March 22, 2022.
Products
More information about the concepts and use of data from the Job Vacancy and Wage Survey is available online in the Guide to the Job Vacancy and Wage Survey (75-514-G).
The product "Labour Market Indicators, by province, territory and economic region, unadjusted for seasonality" (71-607-X) is also available. This dynamic web application provides access to Statistics Canada's labour market indicators for Canada, by province, territory and economic region, and allows users to view a snapshot of key labour market indicators, observe geographical rankings for each indicator using an interactive map and table, and easily copy data into other programs.
Contact information
For more information, or to enquire about the concepts, methods or data quality of this release, contact us (toll-free 1-800-263-1136; 514-283-8300; infostats@statcan.gc.ca) or Media Relations (statcan.mediahotline-ligneinfomedias.statcan@statcan.gc.ca).
- Date modified:


