Infographic 1
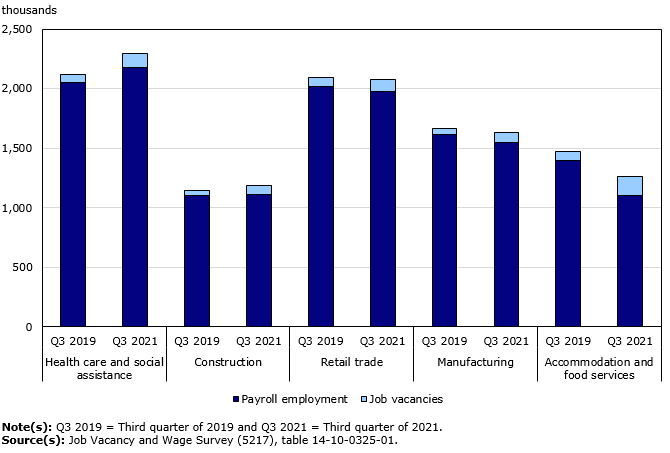
Five sectors account for two-thirds of the increase in job vacancies over the past two years

Infographic description
The title of the infographic is "Five sectors account for two-thirds of the increase in job vacancies over the past two years"
This is a stacked bar chart.
The vertical axis shows thousands from 0 to 2,500 by increments of 500.
The horizontal axis shows the third quarter of 2019 and third quarter of 2021 for each selected sector.
There are 2 stacked bars for each third quarter which represent payroll employment in royal blue and job vacancies in light blue.
The first set of stacked bars represent the third quarter of 2019 for health care and social assistance, with payroll employment at 2,049.0 (in thousands) and job vacancies at 66.1 (in thousands).
The second set of stacked bars represent the third quarter of 2021 for health care and social assistance, with payroll employment at 2,175.3 (in thousands) and job vacancies at 118.2 (in thousands).
The third set of stacked bars represent the third quarter of 2019 for construction, with payroll employment at 1,099.6 (in thousands) and job vacancies at 41.0 (in thousands).
The fourth set of stacked bars represent the third quarter of 2021 for construction, with payroll employment at 1,112.6 (in thousands) and job vacancies at 75.3 (in thousands).
The fifth set of stacked bars represent the third quarter of 2019 for retail trade, with payroll employment at 2,018.7 (in thousands) and job vacancies at 71.7 (in thousands).
The sixth set of stacked bars represent the third quarter of 2021 for retail trade, with payroll employment at 1,972.1 (in thousands) and job vacancies at 104.1 (in thousands).
The seventh set of stacked bars represent the third quarter of 2019 for manufacturing, with payroll employment at 1,613.4 (in thousands) and job vacancies at 50.0 (in thousands).
The eighth set of stacked bars represent the third quarter of 2021 for manufacturing, with payroll employment at 1,545.9 (in thousands) and job vacancies at 81.2 (in thousands).
The ninth set of stacked bars represent the third quarter of 2019 for accommodation and food services, with payroll employment at 1,398.2 (in thousands) and job vacancies at 76.6 (in thousands).
The tenth set of stacked bars represent the third quarter of 2021 for accommodation and food services, with payroll employment at 1,100.3 (in thousands) and job vacancies at 163.0 (in thousands).
Source(s): Job Vacancy and Wage Survey (5217), table 14-10-0325-01.
- Date modified: