Business innovation and growth support, 2019
Archived Content
Information identified as archived is provided for reference, research or recordkeeping purposes. It is not subject to the Government of Canada Web Standards and has not been altered or updated since it was archived. Please "contact us" to request a format other than those available.
Released: 2021-12-02
The Canadian federal government manages programs that offer Business Innovation and Growth Support (BIGS) through its departments and agencies. These government programs provide financial and service-based support for innovation and growth to for-profit businesses and not-for-profit organizations such as government organizations and educational institutions. The BIGS data supports program evaluation, assists with statistical analysis on the impact of innovation programs and provides a better understanding of the characteristics of the enterprises receiving support.
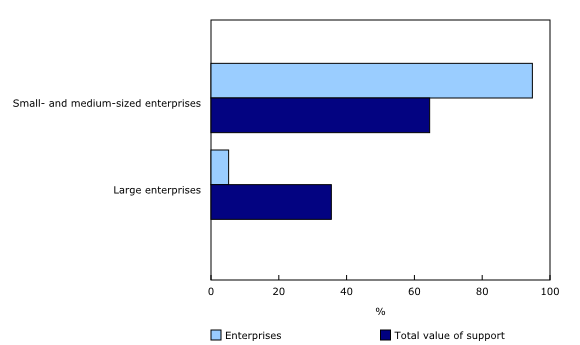
In 2019, similarly to 2018, small and medium-sized enterprises accounted for the vast majority of BIGS beneficiaries.
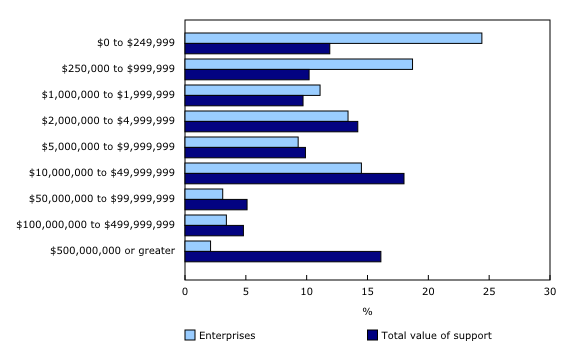
Enterprises having annual revenues of $2 million or more received over two-thirds of the total value of federal support.
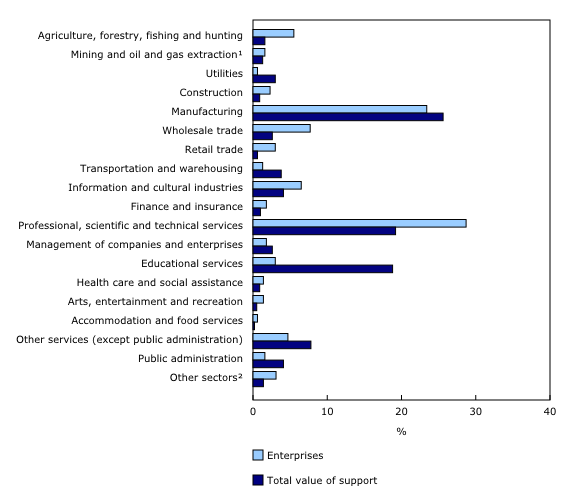
By sector, services-producing enterprises received a little over two-thirds of the total value of support.
Women-owned enterprises represented just under one-fifth of small and medium-sized beneficiary enterprises. Notably, the share of women-owned enterprises in the services industries was highest in public administration (43.8%) and educational services (39.1%).
The vast majority of businesses that received support were small and medium-sized enterprises
The small and medium-sized enterprises (SME) with fewer than 100 employees accounted for 84.5% of the enterprises receiving support, while those with 100 to 499 employees made up 10.2%. Large enterprises, having 500 or more employees, comprised 5.2% of the enterprises.
In 2019, small enterprises received 52.4% of the total value of support and medium enterprises received 12.1%, respectively receiving an average value of support of $100,121 and $191,035 per enterprise. In contrast, large enterprises received 35.5% of the total value of support which was on average $1,092,413 per enterprise.
Over two-thirds of the total value of support went to enterprises having annual revenues of $2 million or more
In 2019, 68.2% of the total value of support went to enterprises with revenues of $2 million or more, which represented an average benefit of $186,768 per enterprise. In contrast, enterprises with revenues under $2 million received 31.8% of the total value of support, which amounts to an average of $73,552 per enterprise.
Over one-half of the enterprises (54.2%) that received federal innovation and growth support had revenues less than $2 million, whereas 45.8% of the beneficiaries had revenues of $2 million or more in 2019.
Manufacturing enterprises received over one-quarter of the total value of support
Over two-thirds (67.5%) of the total value of support went to enterprises in the services sectors, whereas 32.5% went to goods-producing enterprises. Similarly, just over two-thirds (66.7%) of the number of BIGS recipients were in the services sectors and one-third (33.3%) of recipients were goods-producing enterprises. Moreover, just under one-quarter (23.4%) of the total number of businesses within BIGS were in the manufacturing sector.
The sectors accounting for nearly two-thirds (63.7%) of the total value of support were: manufacturing (25.6%); professional, scientific and technical services (19.2%); and educational services (18.8%). Within manufacturing, the three subsectors that received significant shares of the total value of support were: machinery manufacturing (17.9%), primary metal manufacturing (17.6%) and transportation on equipment manufacturing (13.4%).
Women-owned enterprises accounted for over one-fifth of beneficiaries in services industries
Women-owned enterprise beneficiaries represented 18.5% of SMEs and 22.7% of large enterprises. Women-owned enterprises were slightly more concentrated in the services sectors, accounting for 21.2% of those enterprises, compared to 15.6% in the goods-producing sectors.
The share of women-owned enterprises in the services industries was highest in public administration (43.8%) and educational services (39.1%). It was lowest in the management of companies and enterprises sector (11.1%), followed by the finance and insurance sector (13.7%) and the transportation and warehousing sector (13.7%).
In the goods-producing sectors, utilities had the highest proportion of women-owned enterprises (16.4%), followed closely by manufacturing (16.0%). The lowest proportions were found in the construction sector (14.9%) and in the mining, quarrying, and oil and gas extraction sector (11.3%).
Women-owned enterprises received 13.7% of the value of support within goods-producing sectors. The two industries with the highest proportion of value of support to women-owned enterprises were construction (19.3%) and manufacturing (14.1%). The two lowest sectors were mining, quarrying and oil and gas extraction (4.1%), followed by agriculture, forestry, fishing and hunting (12.0%).
In comparison, women-owned enterprises received 19.7% of the value of support within the services industries. Those enterprises received almost one-half of the value of support in the finance and insurance sector (49.5%) and also in other services (except public administration) sector (34.2%). However, they received a lower share of the value of support in transportation and warehousing (1.4%) and management of companies and enterprises (0.4%).
Note to readers
Small enterprises are enterprises with fewer than 100 employees in a given year. Medium-sized enterprises have between 100 and 499 employees annually, while large enterprises have 500 or more employees in a given year.
In this analysis, gender (male or female) is provided for the individual who is most likely to be the enterprise's "primary owner" (owner or manager) amongst the enterprise's known owners and office bearers.
The average value of support per enterprise in an employment or revenue category is expressed as the value of support in an employment or revenue category divided by the number of enterprises in the same category.
The BIGS database comprises a large number of advisory services as well as enterprises in a consortium with no reported value of support. Some industries may have more enterprises that received services, which could affect the average support per enterprise.
In this release, the total value of support excludes enterprises with no available data on employment, revenue or industry classification. However, in the data tables, these enterprises are included in the total value of support.
Products
The infographic "Beneficiaries of federal business innovation and growth support programs, 2019" is now available as part of the series Statistics Canada — Infographics (11-627-M).
Contact information
For more information, or to enquire about the concepts, methods or data quality of this release, contact us (toll-free 1-800-263-1136; 514-283-8300; infostats@statcan.gc.ca) or Media Relations (statcan.mediahotline-ligneinfomedias.statcan@statcan.gc.ca).
- Date modified:


