Canadian international trade in services, September 2021
Archived Content
Information identified as archived is provided for reference, research or recordkeeping purposes. It is not subject to the Government of Canada Web Standards and has not been altered or updated since it was archived. Please "contact us" to request a format other than those available.
Released: 2021-11-04
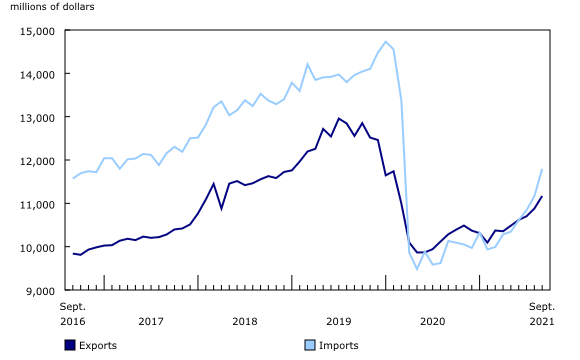
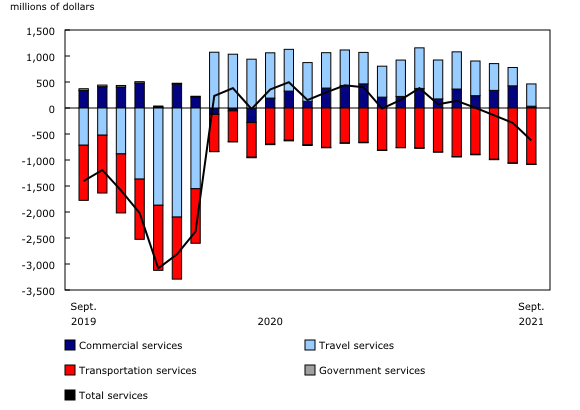
Canada's monthly international trade in services deficit widened from $285 million in August to $624 million in September. Overall, imports of services increased 5.6% to $11.8 billion, and exports were up 2.7% to $11.2 billion.
To explore the most recent results of Canada's international trade in services in an interactive format, see the International trade monthly interactive dashboard.
Imports of commercial services rose 5.4% to $8.2 billion in September, entirely due to higher imports of financial services. Exports of commercial services edged up 0.3% to $8.2 billion.
Imports of travel services rose 17.3% to $1.2 billion in September, marking a sixth consecutive monthly increase. Meanwhile, exports of travel services increased 18.4% to $1.6 billion in September. The growth in travel services for both imports and exports reflected an increase in the number of international travellers following the loosening of COVID-19-related travel and border restrictions.
On September 7, fully vaccinated residents of countries other than the United States became eligible to enter Canada for non-essential reasons, including tourism. Residents of the United States became eligible on August 9. Despite recent increases, imports of travel services in September were still 74.2% below their pre-pandemic February 2020 level, and exports of travel services were 34.3% below their February 2020 level.
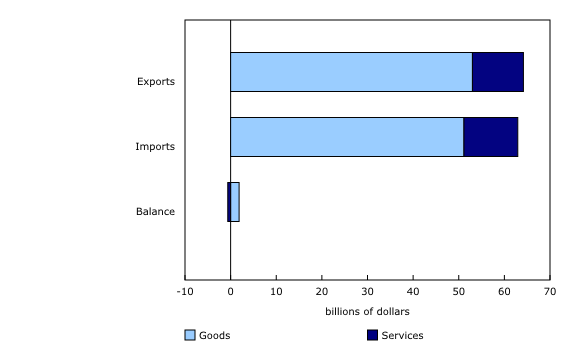
By comparison, total imports of goods declined 3.0% to $51.1 billion in September, and total exports of goods were down 2.3% to $53.0 billion, resulting in a goods surplus of $1.9 billion. Combined, the trade balance for goods and services amounted to a $1.2 billion surplus in September, a $10 million increase from August.
The services trade deficit for August, first reported at $361 million, was revised down to $285 million with this month's release. By category of services, the travel services balance for August, first reported as a $46 million deficit, was revised to a $353 million surplus with this month's release. This was mostly because of the upward revisions to education-related travel services exports. Meanwhile, the transportation services deficit for August, first estimated at $731 million, was revised up by $327 million due to upward revisions to imports of water transport services.
The combined goods and services surplus increases in the third quarter
On a quarterly basis, imports of services increased 8.2% to $33.8 billion in the third quarter, as travel services more than doubled from the previous quarter. Imports of transportation services (+10.0%) and commercial services (+1.9%) also increased in the quarter. Exports of services rose 4.1% to $32.8 billion, as travel services (+19.2%) and commercial services (+1.9%) recorded significant quarterly increases. The services trade balance for the third quarter of 2021 amounted to a deficit of $1.0 billion—a $1.3 billion change from a surplus of $213 million in the second quarter.
Total exports of goods increased 5.0% to $161.3 billion in the third quarter, and total imports were up 3.2% to $157.2 billion, resulting in a surplus of $4.0 billion—a $2.9 billion increase from the second quarter. Combined, the quarterly trade balance for goods and services amounted to a surplus of $3.0 billion, up from $1.3 billion in the second quarter.
Note to readers
Revisions and coverage
This release integrates revisions to international trade in commercial, travel, transportation, and government services from 2018, reflecting the newest annual benchmark surveys and data published on October 15 in the annual international trade in services for 2020 release. These revisions will also be integrated into Canada's national and international accounts at the end of November 2021.
Both exports and imports of services were revised upward from 2018 onward. Most of these revisions were derived from the use of more recent annual data sources.
The education-related travel services estimates for expenses by foreign students in Canada have been revised upward due to updates to enrollment statistics and average spending estimates. Enhancements to the methodology to convert the enrolment data, usually available on a school-year basis, into calendar-year values were also introduced.
For commercial services, the coverage of enterprises involved in the digital economy was enhanced, as was the coverage of imports of digital services, such as digitally downloaded software, online gaming, and video and audio streaming.
Finally, updated information and methodology related to the measurement of imports of water transportation services have been integrated, resulting in upward revisions to these imports, notably in 2021.
COVID-19 and additional data sources
Circumstances surrounding COVID-19 pose issues for the production of monthly international trade in services statistics, particularly for travel and transportation services.
To better capture the effects of the COVID-19 pandemic, Statistics Canada is incorporating data from the Canada Border Services Agency's primary inspection kiosks into its monthly international trade-in-services program. These are electronic customs declaration kiosks that have been installed in most major Canadian airports. While these data represent only a subset of total travellers, they provide relevant and timely insights.
Further information on the estimation methodology is available upon request.
Products
The updated Canada and the World Statistics Hub (13-609-X) is available online. It illustrates the nature and extent of Canada's economic and financial relationship with the world using interactive charts and tables. This product provides easy access to information on trade, investment, employment and travel between Canada and a number of countries, including the United States, the United Kingdom, Mexico, China, Japan, Belgium, Italy, the Netherlands, and Spain.
The Methodological Guide: Canadian System of Macroeconomic Accounts (13-607-X) is available.
The User Guide: Canadian System of Macroeconomic Accounts (13-606-G) is also available. This publication will be updated to maintain its relevance.
Contact information
For more information, contact us (toll-free 1-800-263-1136; 514-283-8300; STATCAN.infostats-infostats.STATCAN@canada.ca).
To enquire about the concepts, methods or data quality of this release, contact Alec Forbes (613-668-6454; alec.forbes@canada.ca), International Accounts and Trade Division.
- Date modified:


