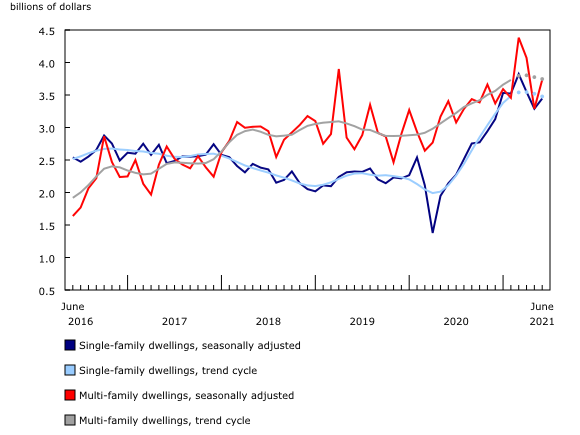
Chart 2
Value of building permits for the single-family and multi-family components

Note(s):
The higher variability associated with the trend-cycle estimates is indicated with a dotted line on the chart for the current reference month and the three previous months. For more information, see the note to readers.
Source(s):
Table 34-10-0066-01.
Chart description
This is a line chart.
| Single-family dwellings, seasonally adjusted | Single-family dwellings, trend cycle | Multi-family dwellings, seasonally adjusted | Multi-family dwellings, trend cycle | |
|---|---|---|---|---|
| June 2016 | 2.540 | 2.516 | 1.638 | 1.918 |
| July 2016 | 2.474 | 2.556 | 1.769 | 2.002 |
| August 2016 | 2.553 | 2.604 | 2.066 | 2.115 |
| September 2016 | 2.655 | 2.643 | 2.219 | 2.247 |
| October 2016 | 2.877 | 2.671 | 2.865 | 2.366 |
| November 2016 | 2.753 | 2.676 | 2.468 | 2.402 |
| December 2016 | 2.492 | 2.661 | 2.238 | 2.387 |
| January 2017 | 2.612 | 2.654 | 2.247 | 2.338 |
| February 2017 | 2.597 | 2.638 | 2.499 | 2.302 |
| March 2017 | 2.750 | 2.631 | 2.134 | 2.279 |
| April 2017 | 2.579 | 2.609 | 1.968 | 2.290 |
| May 2017 | 2.734 | 2.596 | 2.427 | 2.365 |
| June 2017 | 2.452 | 2.566 | 2.708 | 2.440 |
| July 2017 | 2.485 | 2.549 | 2.519 | 2.462 |
| August 2017 | 2.555 | 2.546 | 2.430 | 2.457 |
| September 2017 | 2.551 | 2.560 | 2.372 | 2.450 |
| October 2017 | 2.558 | 2.585 | 2.559 | 2.445 |
| November 2017 | 2.583 | 2.593 | 2.387 | 2.453 |
| December 2017 | 2.743 | 2.597 | 2.243 | 2.512 |
| January 2018 | 2.580 | 2.566 | 2.618 | 2.631 |
| February 2018 | 2.544 | 2.523 | 2.793 | 2.773 |
| March 2018 | 2.407 | 2.470 | 3.084 | 2.887 |
| April 2018 | 2.310 | 2.416 | 2.996 | 2.944 |
| May 2018 | 2.440 | 2.376 | 3.011 | 2.968 |
| June 2018 | 2.383 | 2.339 | 3.016 | 2.935 |
| July 2018 | 2.355 | 2.305 | 2.943 | 2.887 |
| August 2018 | 2.151 | 2.263 | 2.546 | 2.864 |
| September 2018 | 2.194 | 2.228 | 2.812 | 2.874 |
| October 2018 | 2.324 | 2.186 | 2.924 | 2.889 |
| November 2018 | 2.145 | 2.139 | 3.038 | 2.961 |
| December 2018 | 2.052 | 2.109 | 3.176 | 3.025 |
| January 2019 | 2.018 | 2.099 | 3.099 | 3.055 |
| February 2019 | 2.109 | 2.119 | 2.750 | 3.074 |
| March 2019 | 2.097 | 2.156 | 2.899 | 3.084 |
| April 2019 | 2.239 | 2.210 | 3.900 | 3.095 |
| May 2019 | 2.311 | 2.259 | 2.845 | 3.062 |
| June 2019 | 2.323 | 2.292 | 2.666 | 3.021 |
| July 2019 | 2.318 | 2.297 | 2.883 | 2.968 |
| August 2019 | 2.369 | 2.274 | 3.350 | 2.962 |
| September 2019 | 2.202 | 2.259 | 2.918 | 2.914 |
| October 2019 | 2.143 | 2.266 | 2.862 | 2.870 |
| November 2019 | 2.232 | 2.252 | 2.464 | 2.869 |
| December 2019 | 2.217 | 2.234 | 2.900 | 2.872 |
| January 2020 | 2.266 | 2.201 | 3.270 | 2.881 |
| February 2020 | 2.539 | 2.130 | 2.934 | 2.890 |
| March 2020 | 2.108 | 2.047 | 2.643 | 2.919 |
| April 2020 | 1.377 | 1.991 | 2.768 | 2.981 |
| May 2020 | 1.948 | 2.013 | 3.167 | 3.063 |
| June 2020 | 2.141 | 2.112 | 3.405 | 3.145 |
| July 2020 | 2.273 | 2.262 | 3.078 | 3.224 |
| August 2020 | 2.515 | 2.441 | 3.286 | 3.316 |
| September 2020 | 2.754 | 2.649 | 3.437 | 3.371 |
| October 2020 | 2.772 | 2.851 | 3.386 | 3.420 |
| November 2020 | 2.943 | 3.036 | 3.661 | 3.502 |
| December 2020 | 3.130 | 3.213 | 3.371 | 3.563 |
| January 2021 | 3.532 | 3.378 | 3.590 | 3.659 |
| February 2021 | 3.522 | 3.484 | 3.457 | 3.732 |
| March 2021 | 3.822 | 3.540 | 4.382 | 3.794 |
| April 2021 | 3.548 | 3.544 | 4.072 | 3.803 |
| May 2021 | 3.289 | 3.519 | 3.288 | 3.775 |
| June 2021 | 3.445 | 3.478 | 3.732 | 3.746 |
Note(s):
The higher variability associated with the trend-cycle estimates is indicated with a dotted line on the chart for the current reference month and the three previous months. For more information, see the note to readers.
Source(s):
Table 34-10-0066-01.
- Date modified: