Control and sale of alcoholic beverages, year ending March 31, 2020
Archived Content
Information identified as archived is provided for reference, research or recordkeeping purposes. It is not subject to the Government of Canada Web Standards and has not been altered or updated since it was archived. Please "contact us" to request a format other than those available.
Released: 2021-04-21
COVID-19
These figures relate to the year ending March 31, 2020, and, as such, only reflect the impacts of the first two weeks of the COVID-19 pandemic.
For more recent information on the sale of alcoholic beverages, the monthly release of retail trade sales by province and territory (table 20-10-0008-01) on May 21, 2021 will contain total sales by beer, wine and liquor stores for the March 2021 reference period.
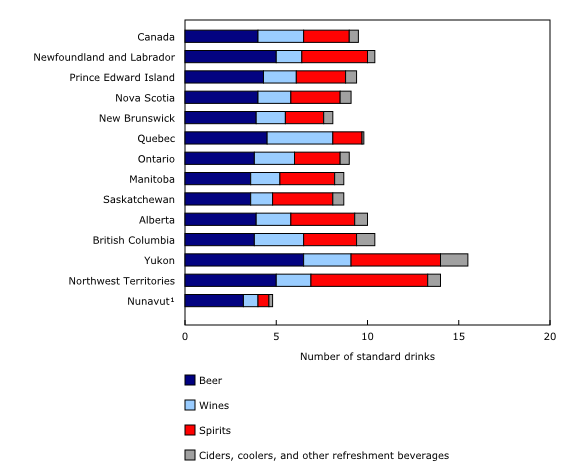
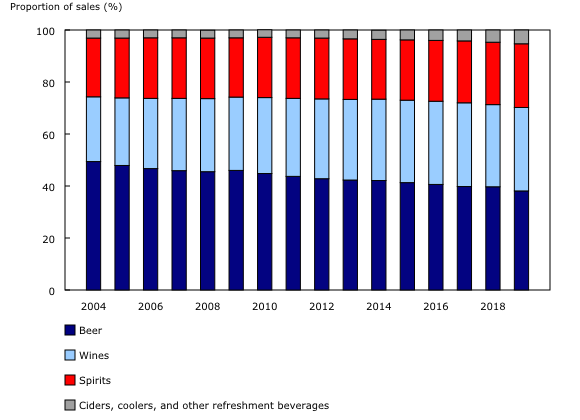
Canadians over the legal drinking age bought the equivalent of 9.5 standard alcoholic beverages a week in 2019/2020, totalling 3,116 million litres. This was up 0.7% from a year earlier. Beer remained the alcoholic beverage of choice for Canadians, but it continued to lose market share to wine, spirits and ciders and coolers.
Retail sales data show that alcohol sales for March 2020 were up 17.5% from the previous month and up 19.2% compared with sales in March 2019. Liquor authorities confirmed this surge in sales. Many of them reported that their customers were stockpiling alcohol in the last two weeks of March 2020 because of the uncertainty about potential closures caused by the COVID-19 pandemic. Retail sales data also show an increase in alcohol sales for the 10-month period from April 2020 to January 2021. If this trend continues, sales for the year ending March 2021—the first full year of alcohol sales that reflect pandemic-related purchasing habits—will have increased significantly from the year before.
Total beer sales by liquor stores, agencies and other retail outlets fell 0.6% to $9.3 billion during the fiscal year 2019/2020—the first decrease in six years.
Wine sales rebounded from their slow growth a year earlier (+0.2%), rising 5.2% to $7.8 billion in 2019/2020.
Sales of spirits grew 6.0% to $6.0 billion. Cider and cooler sales rose at the fastest pace among all alcohol types for the eighth straight year, up 17.2% to $1.3 billion in 2019/2020.
While beer remained the alcoholic beverage of choice for Canadians in 2019/2020, accounting for 38.1% of total alcohol sales, it lost 1.6% of its market share to wine (+0.5% to 32.1%), spirits (+0.5% to 24.5%) and ciders and coolers (+0.6% to 5.3%).
Overall, $24.5 billion worth of alcoholic beverages were sold in the fiscal year ending March 31, 2020, up 3.6% from a year earlier.
Net income and other government revenue derived from the control and sale of alcoholic beverages, including excise taxes, retail sales taxes, specific taxes on alcohol, and licence and permit revenues, increased 3.3% to $12.8 billion.
Beer sales per person hits new low
Beer sales fell 0.6% to $9.3 billion in 2019/2020. Residents of Nunavut were most likely to buy beer (66.8% of total sales), while those in British Columbia (31.4%) were the least likely to do so.
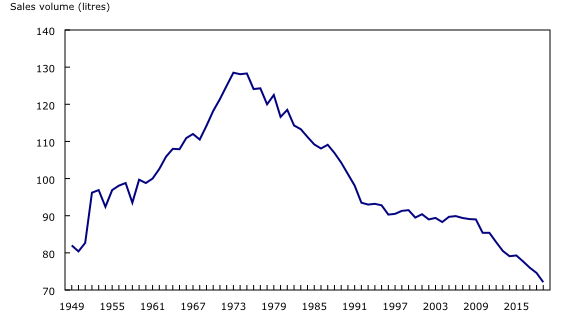
By volume, beer sales declined by 1.7% to 2,171 million litres or 72.1 litres of beer per person over the legal drinking age. This was the lowest per person volume ever reported for beer sales since Statistics Canada began tracking alcohol sales in 1950.
Canadians over the legal drinking age bought the equivalent of 4.0 standard bottles of beer a week in 2019/2020 (see Note to readers).
Wine sales continue to grow
Wine sales rose 5.2% to $7.8 billion in 2019/2020 – the largest increase in eight years.
While beer was the alcoholic beverage of choice across much of Canada last year, wine claimed the top spot in Quebec (44.0% of total sales) and British Columbia (34.3%). Residents of Saskatchewan (15.2%) were least likely to buy wine.
Red was the wine of choice for just over half of Canadians (53.2%), followed by white (33.5%), sparkling (6.4%) and rosé, fortified and other wines (7.0%).
Canadians of legal drinking age bought the equivalent of 2.5 glasses of wine in 2019/2020.
By volume, wine sales increased by 4.1% to 527 million litres.
Spirit sales rise
Spirit sales rose 6.0% from a year earlier to $6.0 billion during the fiscal year ending March 31, 2020.
Spirits were the biggest seller in the Northwest Territories (42.7% of total sales) and accounted for the smallest share in neighbouring Nunavut (9.8%). Overall, sales of Canadian spirits increased by 5.9% while imported spirit sales rose 6.1%.
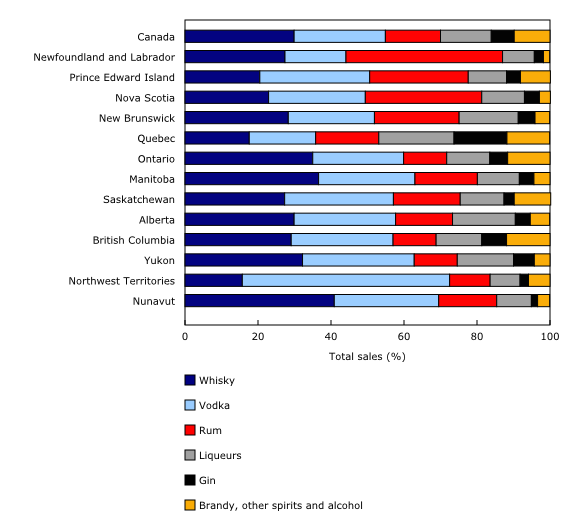
Nationally, whisky (29.9%), vodka (25.0%) and rum (15.1%) were the most popular spirits sold in Canada in 2019/2020, accounting for over two-thirds (70.0%) of total spirit sales.
Canadians over the legal drinking age bought the equivalent of 2.5 shots of spirits per week in 2019/2020. By volume, spirits sold increased 4.0% to 181.3 million litres.
Among spirits, gin sales have grown at the fastest pace over the past decade, rising by almost two-thirds (+63.3%) from 2009/2010 to 2019/2020.
Ciders, coolers and other refreshment beverages remains the fastest growing alcoholic beverage
Canadians bought $1.3 billion worth of ciders and coolers in 2019/2020, up 17.2% from the previous fiscal year.
Residents of Yukon (9.8% of total sales) were most likely to buy ciders and coolers while those in Quebec (1.4%) were the least likely to do so.
In terms of volume, 236.9 million litres of ciders and coolers were sold in 2019/2020, up 15.6% from the previous fiscal year.
Spirit cooler sales have more than doubled over the past decade. Since 2009/2010, the volume of sales rose by 166.3%.
Note to readers
Comparability and limitations of data
Data on sales of alcoholic beverages by volume should not be equated with data on consumption of alcoholic beverages. Sales volumes only include sales as reported by the liquor authorities and their agencies, including sales by wineries, breweries and other outlets that operate under license from the liquor authorities.
Statistics on sales of alcoholic beverages by dollar value should not be equated with consumer expenditures on alcoholic beverages. The sales data refer to the revenues received by liquor authorities and their agents, and a portion of these revenues include sales to licensed establishments such as bars and restaurants, some of which would be considered as business intermediate expenses.
The value of sales of alcoholic beverages excludes all sales taxes, the value of returnable containers, and deposits. Absolute volume of sales of alcoholic beverages is calculated by multiplying the sales volume by the percentage of alcohol content for each product category.
Standard drink
According to Health Canada guidelines, a standard drink is defined as a 341 mL (12 oz.) beer, cooler, or cider with 5% alcohol content, a 142 mL (5 oz.) glass of wine with 12% alcohol content, or a 43 mL (1.5 oz.) spirit drink with 40% alcohol.
Legal drinking age versus per capita
Standard drinks per week per person are calculated for each person over the legal drinking age in Canada. The legal drinking age is 19 years and older in every province and territory except Quebec, Manitoba and Alberta, where it is 18 years and older.
Per capita sales by value and volume are based on the population of inhabitants aged 15 years and older. This allows comparability with other countries, the Organisation of Economic Co-operation and Development and the World Health Organization as they also present alcohol-per-capita data using the population of inhabitants aged 15 years and older.
Contact information
For more information, or to enquire about the concepts, methods or data quality of this release, contact us (toll-free 1-800-263-1136; 514-283-8300; STATCAN.infostats-infostats.STATCAN@canada.ca) or Media Relations (613-951-4636; STATCAN.mediahotline-ligneinfomedias.STATCAN@canada.ca).
- Date modified:


