Non-profit institutions and volunteering: Economic contribution, 2019 and first quarter to fourth quarter 2020
Archived Content
Information identified as archived is provided for reference, research or recordkeeping purposes. It is not subject to the Government of Canada Web Standards and has not been altered or updated since it was archived. Please "contact us" to request a format other than those available.
Released: 2021-03-29
Real gross domestic product rises
Real gross domestic product (GDP) of non-profit institutions rose 1.3% in the fourth quarter of 2020, following a 2.4% increase in the third quarter of 2020. Increases in the second half of 2020 offset a 2.5% decline in the second quarter of 2020, as a number of non-profit institutions were mandated to temporarily suspend in-person services at that time.
Similar to the real GDP of non-profit institutions, the economy-wide real GDP rose 2.3% in the fourth quarter, following an 8.3% increase in the third quarter. During the year, real GDP of non-profit institutions (+1.5%) outperformed the economy-wide real GDP (-5.4%), mainly on the strength of government non-profit institutions, such as hospitals. Non-profits, excluding government institutions, dropped by 4.1% in 2020, as many organizations were impacted by COVID-19-related restrictions.
Real gross domestic product increases across non-profit institutions in the fourth quarter of 2020
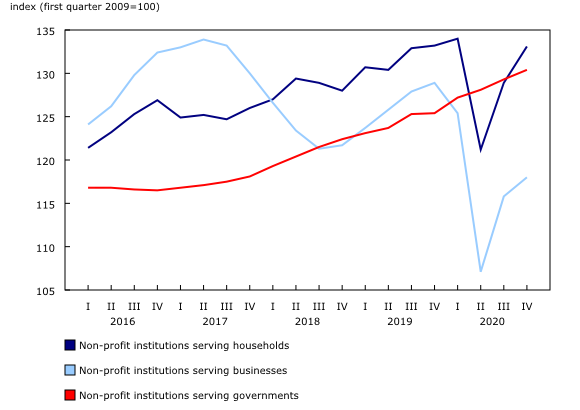
In the fourth quarter of 2020, real GDP of non-profit institutions serving governments rose 0.9%—a 16th consecutive quarterly increase. Health care and education within non-profit institutions serving governments continued to operate throughout the year, as services were re-allocated and often migrated virtually to continue serving individuals. These continued services resulted in a 3.5% increase in real GDP for 2020 relative to 2019.
Non-profit institutions serving households, such as grant-making and giving services, arts and recreation groups, and religious organizations, recorded higher levels of real GDP in the fourth quarter, up 3.2%, following a 6.3% increase in the third quarter. Despite the increase in the second half of 2020, levels remained lower than pre-pandemic highs, as cultural and recreational organizations and religious organizations were temporarily unable to operate in-person services throughout the pandemic.
Real GDP of non-profit institutions serving businesses, such as chambers of commerce and business associations, rose 1.9% in the fourth quarter of 2020—the second consecutive quarterly increase. Non-profit institutions serving businesses recorded the largest annual decline of the three sectors, down 7.9% in 2020. Similar to non-profit institutions serving households, government-mandated business closures impacted real GDP growth in this sector.
Non-profit employment increases
Employment in non-profit institutions rose 1.6% in the fourth quarter of 2020, led by an increase in the number of jobs in social services. Excluding non-profit institutions serving governments, employment in the fourth quarter of 2020 increased 4.8% as businesses continued to ramp up hiring following early pandemic cutbacks. On the year, employment declined 1.5% in non-profit institutions, while non-profit institutions excluding government institutions declined 6.0%, compared with an 8.2% decrease for the economy as a whole.
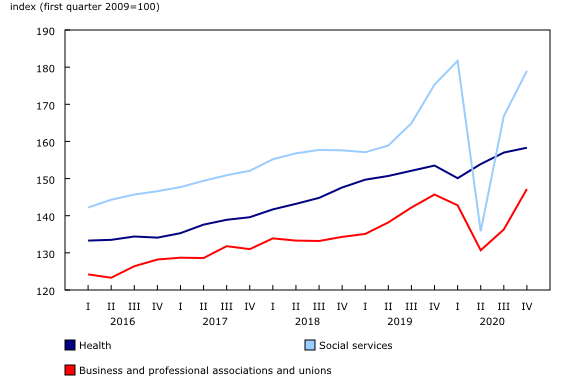
For social service non-profit institutions, employment rose 11.7% in the fourth quarter, following a 33.2% increase in the third quarter. In 2020, the level of employment fell 0.6% on average, mainly owing to a 40% decline in the second quarter.
Staffing within the health care sector declined 1.5% in the fourth quarter of 2020. The drop resulted in a 0.7% decrease from the fourth quarter of 2019. In 2020, the number of jobs within health care remained flat—the only sector to record a non-negative decline in employment.
Nominal gross domestic product of social services, business and professional associations grows
Nominal gross domestic product of non-profit institutions rose 1.6% in the fourth quarter of 2020 on the strength of increased activity in social services (+7.3%), business and professional associations (+8.0%), and health care services (+0.9%). For non-profit institutions excluding government institutions, nominal GDP rose 4.5%, following a 7.7% increase in the third quarter. Overall, non-profit institutions represented 8.7% of the economy-wide nominal GDP in the fourth quarter—down from an 8.9% share in the third quarter.
Nominal GDP in social services activities rose 7.3% in the fourth quarter of 2020, nearly reaching pre-pandemic highs. Widespread government-mandated closures and suspended services resulted in a sharp decline in the second quarter (-25.3%), weighing down on 2020 levels.
In the fourth quarter, business and professional associations recorded a higher level of nominal GDP (+8.0%) as levels reached record highs. The virtual migration of associations online and the re-opening of businesses contributed to the increase, although nominal GDP still declined in 2020, by 0.7%.
Health care non-profit institutions recorded a 0.9% increase in nominal GDP—the third consecutive quarterly growth. Of all activities within non-profit institutions, health care recorded the largest increase in 2020, as services were rapidly re-allocated and expanded to combat COVID-19.
Note to readers
The non-profit indicators are quarterly indicators for the main aggregates in the Satellite Account of Non-profit Institutions and Volunteering, namely, gross domestic product, output and employment. The estimates from this account are directly comparable to the estimates in the Canadian System of Macroeconomic Accounts.
For the purposes of these estimates, the definition of the non-profit sector adheres to international standards published in the United Nations Handbook of Satellite Accounts on Non-profit and Related Institutions and Volunteer Work. Canada's overall non-profit sector is divided into three broad categories as follows:
Community non-profits institutions include organizations engaged, for example, in social services, advocacy or sports and recreation. These make up the "non-profit institutions serving households" sector in standard macroeconomic measures.
Business non-profits institutions include, for example, business associations, chambers of commerce and condominium associations. These are classified to the business sector in standard measures.
Government non-profits institutions include hospitals, some residential care facilities, universities and colleges. These are classified to the government sector in standard measures.
Products
The Latest Developments in the Canadian Economic Accounts (13-605-X) is available.
The User Guide: Canadian System of Macroeconomic Accounts (13-606-G) is available.
The Methodological Guide: Canadian System of Macroeconomic Accounts (13-607-X) is available.
Contact information
For more information, or to enquire about the concepts, methods or data quality of this release, contact us (toll-free 1-800-263-1136; 514-283-8300; STATCAN.infostats-infostats.STATCAN@canada.ca) or Media Relations (613-951-4636; STATCAN.mediahotline-ligneinfomedias.STATCAN@canada.ca).
- Date modified:


