New Housing Price Index, January 2021
Archived Content
Information identified as archived is provided for reference, research or recordkeeping purposes. It is not subject to the Government of Canada Web Standards and has not been altered or updated since it was archived. Please "contact us" to request a format other than those available.
Released: 2021-02-18
January 2021
0.7% 
(monthly change)
January 2021
0.0%
(monthly change)
January 2021
3.3% 
(monthly change)
January 2021
0.0%
(monthly change)
January 2021
0.0%
(monthly change)
January 2021
0.3% 
(monthly change)
January 2021
1.3% 
(monthly change)
January 2021
1.2% 
(monthly change)
January 2021
0.4% 
(monthly change)
January 2021
0.3% 
(monthly change)
January 2021
0.4% 
(monthly change)
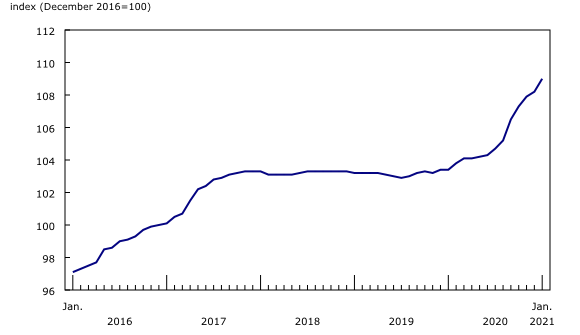
New home prices rose at their fastest pace since October, increasing 0.7% nationally in January.
New Housing Price Index, monthly change
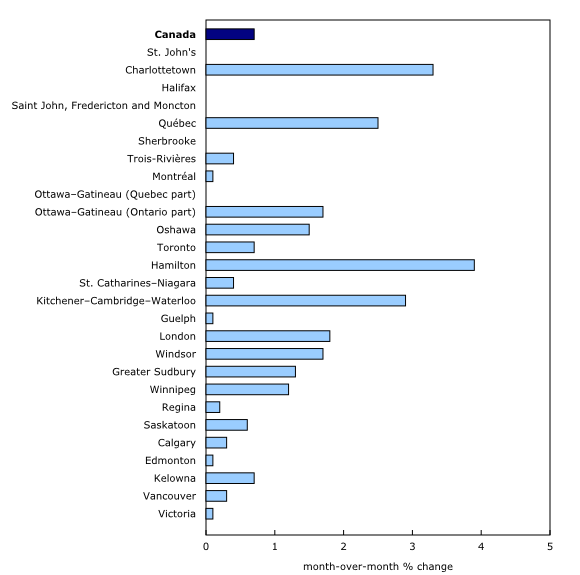
New house prices were up in 22 of the 27 census metropolitan areas (CMAs) surveyed and were unchanged in 5 CMAs. The national index was up for the ninth consecutive month, linked primarily to the decreasing supply of new homes and continuing high demand, driven mainly by lower borrowing costs and consumer desire for more living space during the pandemic.
Low supply and high demand putting upward pressure on house prices
The national housing supply for new single-family homes (single-detached, semis and row houses) has been declining in recent years. According to the Canada Mortgage and Housing Corporation, housing completions for single-family homes in 2020 were down 2.2% compared with 2019 and down 15.2% compared with 2018. While demand has remained strong as a result of homes selling quickly, completed single-family homes still available for sale in December 2020 were down by almost one-third (-29.4%) compared with December 2019.
The largest price movements in January were in Hamilton (+3.9%) and Charlottetown (+3.3%), with builders attributing the increase mainly to higher construction costs.
The rise in new housing prices reported in Kitchener–Cambridge–Waterloo (+2.9%) resulted primarily from a shortage of developed land in the area.
New Housing Price Index, 12-month change
Nationally, new house prices rose 5.4% year over year in January—the largest increase in over a decade (since March 2008).
In January, Ottawa (+15.3%) once again led the increase in new house prices, which it has done for almost three years (since May 2018).
In Kitchener–Cambridge–Waterloo (+13.0%) and Hamilton (+11.2%), new home prices surged in January as a result of their relative affordability compared with homes in Toronto, coupled with a strong demand for single-family homes.
According to the latest property assessment values, for all property types, the value of Toronto homes was on average $340,000 higher than for homes in Kitchener–Cambridge–Waterloo and $270,000 higher compared with those in Hamilton. These two nearby cities both have a strong housing market and attract out-of-town buyers—especially from the Toronto region.
Regina (-1.0%) reported the lone year-over-year decline in January. However, the decrease in new housing prices has been slowing in this city since the record 4.8% drop in July 2020.
Note to readers
The New Housing Price Index (NHPI) measures changes over time in the selling prices of new residential houses. The prices are those agreed upon between the contractor and the buyer at the time the contract is signed. The detailed specifications for each new house remain the same between two consecutive periods.
The prices collected from builders and included in the index are market selling prices less value-added taxes, such as the federal Goods and Services Tax and the provincial harmonized sales tax.
The survey covers the following dwelling types: new single homes, semi-detached homes and townhomes (row or garden homes). The index is available at the national and provincial levels and for 27 census metropolitan areas (CMAs).
The index is not subject to revision and is not seasonally adjusted.
In addition to this monthly release, the NHPI has also been integrated into the Residential Property Price Index (RPPI). The RPPI is a quarterly series that measures changes over time in the prices of residential properties for Montréal, Ottawa, Toronto, Calgary, Vancouver and Victoria. An aggregate for these six CMAs is also available. The RPPI provides a price index for all components of the housing real estate market—new and resale—in addition to a breakdown between houses and condominium apartments.
Products
The article titled "The resilience and strength of the new housing market during the pandemic" examines the changes in new home prices in Canada for the 27 surveyed CMAs captured in the NHPI and compares the ranking of cities based on prices six months into the pandemic (August compared with February).
An article titled "Price trends and outlook in key Canadian housing markets" looks at where the housing market was at the onset of the COVID-19 pandemic, sheds light on what has happened since then and explores the challenges of the Canadian market going forward.
The infographic The impact of COVID-19 on Key Housing Markets, part of the series Statistics Canada – Infographics (11-627-M), is available. It provides an outlook on the housing market before, during and after the onset of the COVID-19 pandemic.
The New Housing Price Index: Interactive Dashboard, which allows users to visualize statistics on new housing prices, is available.
The Housing Market Indicators dashboard, which provides access to key housing market indicators for Canada, by province and by CMA, is also available.
For more information on the topic of housing, visit the housing statistics portal.
The video Producer Price Indexes is available on the Statistics Canada Training Institute webpage. It provides an introduction to Statistics Canada's Producer Price Indexes—what they are, how they are compiled and what they are used for.
Statistics Canada launched the Producer price indexes portal as part of a suite of portals for prices and price indexes. It provides users with a single point of access to a wide variety of statistics and measures related to producer prices.
Next release
The New Housing Price Index for February will be released on March 18.
Contact information
For more information, or to enquire about the concepts, methods or data quality of this release, contact us (toll-free 1-800-263-1136; 514-283-8300; STATCAN.infostats-infostats.STATCAN@canada.ca) or Media Relations (613-951-4636; STATCAN.mediahotline-ligneinfomedias.STATCAN@canada.ca).
- Date modified:


