Consumer Price Index, January 2021
Archived Content
Information identified as archived is provided for reference, research or recordkeeping purposes. It is not subject to the Government of Canada Web Standards and has not been altered or updated since it was archived. Please "contact us" to request a format other than those available.
Released: 2021-02-17
January 2021
1.0% 
(12-month change)
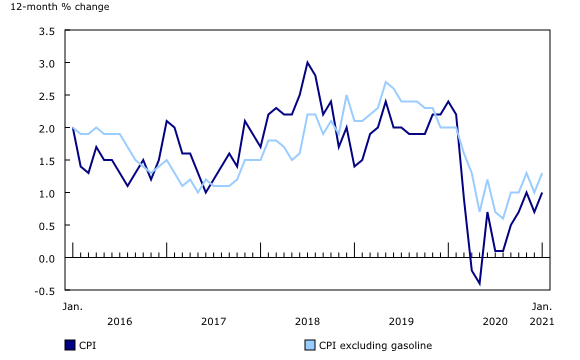
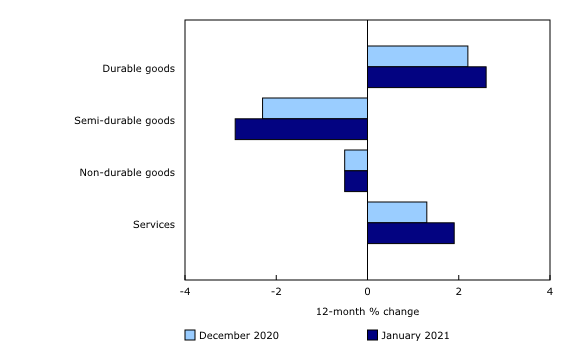
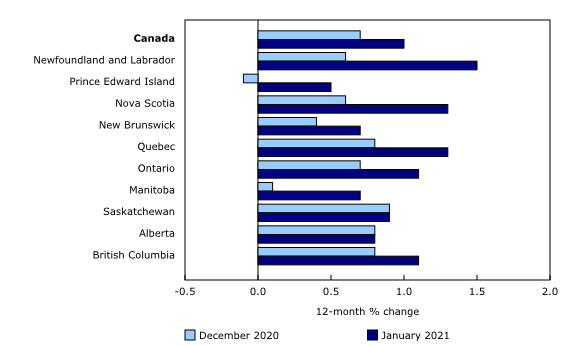
The Consumer Price Index (CPI) rose at a faster pace in January (+1.0%) year over year than in December (+0.7%). The acceleration in consumer prices was largely due to higher prices for durable goods (+1.7%) and rising gasoline prices (+6.1%) compared with December 2020. Excluding gasoline, the CPI grew 1.3% in January—up from a 1.0% increase in December.
On a seasonally adjusted monthly basis, the CPI rose 0.4% in January.
Enhancements and Developments in the Consumer Price Index Program
The Consumer Price Index (CPI) program evolves over time to incorporate innovations and adapt to changing circumstances. The Enhancements and Developments in the Consumer Price Index Program paper aims to inform CPI users of plans for the next CPI basket update, and to highlight upcoming changes and enhancements to the program.
Explore the Consumer Price Index
Check out the Personal Inflation Calculator! This interactive calculator allows you to enter dollar amounts in the common expense categories to produce a personalized inflation rate, which you can compare with the official measure of inflation that represents the average Canadian household—the Consumer Price Index (CPI).
Visit the Consumer Price Index portal to find all CPI data, publications, interactive tools, and announcements highlighting new products and upcoming changes to the CPI in one convenient location.
Check out the Consumer Price Index Data Visualization Tool to access current and historical CPI data in a customizable visual format.
Highlights
The rise in consumer prices (+1.0%) occurred amid continuing economic uncertainty. Although consumer spending expectations are higher with the vaccine on the horizon, physical distancing measures were extended or reimposed in some regions to contain the spread of COVID-19, resulting in employment loss in close-contact sectors.
Steadily increasing commodity prices since April also contributed to the overall rise in consumer prices in January.
Gasoline prices rise for the second consecutive month
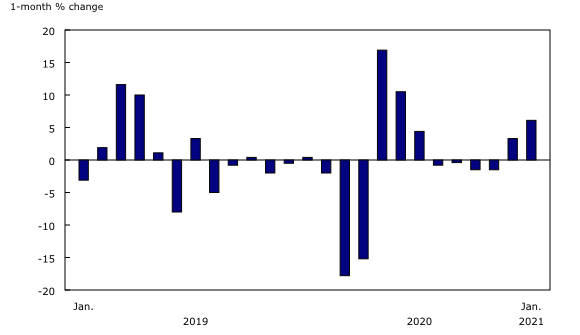
Gasoline prices rose for the second consecutive month, up 6.1% in January compared with December. This increase coincided with production cutbacks by major oil-producing countries in response to low global demand for crude oil.
Nevertheless, gasoline prices were 3.3% lower compared with January 2020, when heightened demand uncertainty first arose in the oil and gas market with the global outbreak of COVID-19.
New models push passenger vehicle prices higher
Year over year, passenger vehicle prices rose at a faster pace in January (+2.9%) compared with December (+2.5%), mainly attributable to higher availability of new model-year vehicles compared with January 2020.
Meat and fresh vegetable prices slow in January
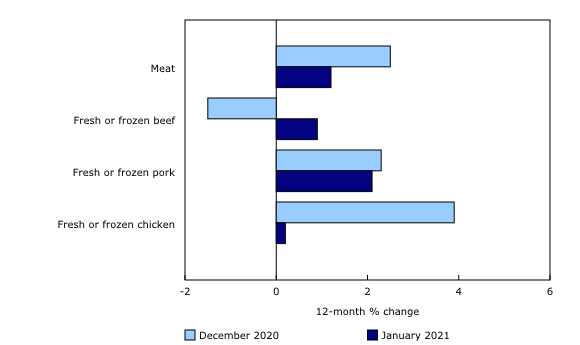
Meat prices grew at half the pace in January (+1.2%) year over year compared with December (+2.5%). This was partly due to much slower price growth year over year for fresh or frozen chicken in January (+0.2%) compared with December (+3.9%).
Prices for fresh vegetables edged up 0.2% year over year, following a 1.1% increase in December. Slower vegetable price growth was attributable to abundant supply following a good harvest in the United States and Mexico, as well as the diversion of food destined for the food service sector towards grocers.
Consumers pay more for phones and phone plans
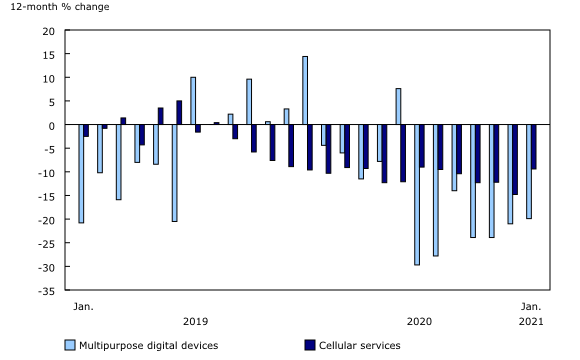
Prices for multipurpose digital devices, including smartphones, were 3.4% higher month over month in January—the highest monthly increase since September 2020.
Prices for telephone services, which include landline and cellular services, rose 4.2% month over month in January, the first monthly increase since July 2020 (+0.2%). In January, prices for cellular services increased 5.5% month over month, following a 4.3% decline in December.
Higher monthly prices for smartphones and service plans in January were largely a result of holiday promotions ending. Despite the monthly increases, prices for multipurpose digital devices (-19.9%) and cellular services (-9.4%) were lower year over year.
Air transportation price index declines in January
Airfares were down 5.5% year over year in January, the seventh consecutive monthly decline since July 2020. Lower prices coincided with ongoing advisories against non-essential travel.
Travel tours and COVID-19
In the wake of international travel advisories, travel tours remained unavailable to consumers in January. A general imputation strategy for services not available to consumers resulted in prices for travel tours being replaced with an imputed movement from the all-items CPI. This imputation effectively removed the impact of travel tours from the monthly CPI movement. At times, this approach has resulted in large year-over-year index movements because prices for travel tours often fluctuate significantly throughout the year, given the highly seasonal nature of travel services.
In January 2020, the travel tours index fell 6.9% during a period of low seasonal demand for international travel. As a result of this decline falling out of the 12-month movement, which resulted in upward pressure on the index in January 2021, and the imputation treatment applied, the travel tours index was up 31.1% compared with January 2020. Given the treatment applied to this index, interpretation of the 12-month price change indicator for travel tours should be done with caution.
Regional highlights
Prices rose more year over year in January than in December in eight provinces, led by Newfoundland and Labrador (+1.5%). Prices rose at the slowest pace in Prince Edward Island (+0.5%), mostly attributable to lower heating fuel costs.
Electricity prices decrease in Ontario
Electricity cost 4.4% less in January compared with the same month a year earlier. The decline was most pronounced in Ontario, where consumers paid 13.7% less, largely because the provincial government set all time-of-use electricity prices to the off-peak rate for 40 days, beginning on January 1, 2021.
Note to readers
The Consumer Price Index (CPI) measures the change in prices of consumer goods and services over time. To accurately reflect trends in the market, Statistics Canada periodically updates the methods applied to various components of the CPI.
Enhancement: New approach to estimating the computer equipment, software and supplies index
With the release of January 2021 CPI data on February 17, 2021, the computer equipment, software and supplies index was updated with an enhanced methodology and new data sources. This index represents 0.42% of the 2017 CPI basket and is part of the recreation, education and reading component.
Detailed documentation is available in the Prices Analytical Series (62F0014M) describing the new approach to estimating the computer equipment, software and supplies index.
Upcoming enhancement: Resale housing data to be incorporated into the Mortgage Interest Cost Index
Following the release of the Residential Property Price Index, the CPI will incorporate resale house prices into the house sub-index of the Mortgage Interest Cost Index (MICI). This enhancement will be published with the February 2021 CPI data (on March 17, 2021); it does not represent a change in methodology. More information on this enhancement will be included with the February 2021 release of the CPI.
The MICI represents 3.57% of the 2017 CPI basket and is part of the shelter component of the CPI. More information on the MICI model can be found in Chapter 10 of The Canadian Consumer Price Index Reference Paper.
COVID-19 and the Consumer Price Index
Statistics Canada continues to monitor the impacts of the novel coronavirus (also known as COVID-19) on Canada's CPI.
Goods and services in the CPI that were not available to consumers in January because of COVID-19 restrictions received special treatments, effectively removing their impact on the monthly CPI. The following sub-indexes were imputed from the monthly change in the all-items index: travel tours, components of spectator entertainment, recreational services, personal care services in some areas, and some components of use of recreational facilities and services in some areas.
The price indexes for beer served in licensed establishments, wine served in licensed establishments and liquor served in licensed establishments were imputed in several regions, using the indexes to which consumers likely redirected their expenditures: beer purchased from stores, wine purchased from stores and liquor purchased from stores.
Consistent with previous months affected by the COVID-19 pandemic, prices for suspended flights are excluded from the January CPI calculation because passengers were ultimately unable to consume them. As a result, selected sub-components of the air transportation index were imputed from the parent index (air transportation).
A document entitled Technical Supplement for the January 2021 Consumer Price Index is available in the Prices Analytical Series (62F0014M) publication, with further details on the imputations used to compile the January 2021 CPI.
Real-time data tables
Real-time data table 18-10-0259-01 will be updated on March 1. For more information, consult the document Real-time CANSIM tables.
Next release
The Consumer Price Index for February will be released on March 17, 2021.
Products
The "Consumer Price Index Data Visualization Tool" is available on the Statistics Canada website.
More information on the concepts and use of the Consumer Price Index (CPI) is available in The Canadian Consumer Price Index Reference Paper (62-553-X).
For information on the history of the CPI in Canada, consult the publication Exploring the First Century of Canada's Consumer Price Index (62-604-X).
Two videos, "An Overview of Canada's Consumer Price Index (CPI)" and "The Consumer Price Index and Your Experience of Price Change," are available on Statistics Canada's YouTube channel.
Contact information
For more information, or to enquire about the concepts, methods or data quality of this release, contact us (toll-free 1-800-263-1136; 514-283-8300; STATCAN.infostats-infostats.STATCAN@canada.ca) or Media Relations (613-951-4636; STATCAN.mediahotline-ligneinfomedias.STATCAN@canada.ca).
- Date modified:


