Diversity of charity and non-profit boards of directors: Overview of the Canadian non-profit sector
Archived Content
Information identified as archived is provided for reference, research or recordkeeping purposes. It is not subject to the Government of Canada Web Standards and has not been altered or updated since it was archived. Please "contact us" to request a format other than those available.
Released: 2021-02-11
Charities and non-profit organizations play a vital role in supporting and enriching the lives of Canadians. A crowdsourcing survey of individuals involved in the governance of charities and non-profit organizations was conducted from December 4, 2020, to January 18, 2021. The objectives of the survey were to collect timely information on the activities of these organizations and the individuals they serve and to learn more about the diversity of those who serve on their boards of directors. A total of 8,835 (correction) individuals completed the survey, 6,170 (correction) of whom were board members.
Today, Statistics Canada is releasing the findings from this crowdsourcing initiative. Readers should note that, unlike data from other surveys conducted by Statistics Canada, crowdsourcing data are not collected under a design using probability-based sampling. Therefore, caution should be exercised when interpreting the findings from this initiative, and no inferences about the overall makeup of charity and non-profit organization boards of directors should be made based on these results.
Three-quarters of participants are involved in charities and non-profit organizations that operate at the local or regional level
Charities and non-profit organizations can work from the local level to the international level. Almost half (48%) of participants reported that their organization operates at the local level, that is, within a neighbourhood, city, town or rural municipality, and another 28% reported that their organization operates in a region within their province or territory. Overall, 76% of participants were involved in the governance of organizations that operate at the local or regional level. Of the remaining participants, 13% reported that their organization operates at the provincial or territorial level, 8% reported that their organization operates at the national level, and 3% reported that their organization operates internationally.
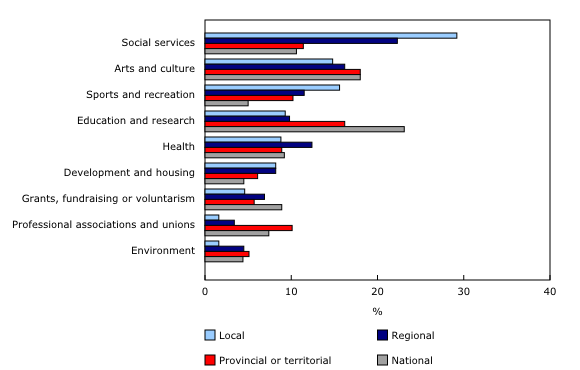
Charities and non-profits organizations engage in a range of activities. Participants were most likely to report that the main activity of their organization pertains to social services (22%) (correction), arts and culture (17%) (correction), sports and recreation (13%) (correction), education and research (12%) (correction), or health (9%) (correction).
Main activities vary somewhat by the organization's geographic level. For example, 29% of organizations operating at the local level were reported to be mainly engaged in social services, while this was the case for 11% of organizations operating at the provincial, territorial or national level. Local organizations were also more likely to be mainly engaged in sports and recreation (16%) than national organizations (5%). Conversely, larger shares of organizations operating at the provincial, territorial or national level were engaged in education and research or in grants and fundraising, or were business or professional associations or unions. Of the crowdsourcing participants involved in organizations operating at the international level, the largest shares reported international activities (29%) (correction) or arts and culture (24%) (correction) as their organization's main activity.
Largest shares of participants report that their organization serves youth or individuals in poverty or with low income
Participants were asked whether their organization serves the population groups listed in the lower half of Table 1. Just over 72% (correction) of participants reported that their organization serves at least two of these population groups, and 64% (correction) reported that their organization serves at least three of them.
At least half of the participants reported that their organization serves Indigenous persons, LGBTQ2+ individuals, or newcomers or visible minorities. Whether this reflects programs or services designed specifically for these groups or whether it reflects programs and services for the general population—including these groups—cannot be discerned from the results.
Slightly larger shares of participants in organizations operating at the local or regional level than participants in organizations operating at the provincial, territorial or national level said their organization serves youth, seniors, persons with disabilities, or persons in poverty or with low income.
Almost one-third of participants report that their organization has a written policy to promote diversity in its board of directors
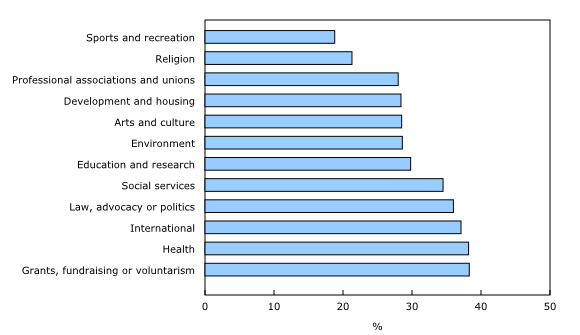
Participants were asked whether their organization has a written policy on the diversity of its board of directors. Just over 30% of participants said their organization does have such a policy, while 47% said it does not. The remaining 23% did not know.
Among crowdsourcing participants involved in national organizations, 42% reported that their organization has a written policy on board diversity. Proportions were slightly lower for participants involved in organizations operating at the local (27%), regional (32%), provincial or territorial (32%), or international (31%) level.
Among all participants, those involved in organizations mainly engaged in sports and recreation or in religious non-profits and charities were least likely to report that their organization has a written policy on board diversity.
Women account for almost 60% of participants who are board members
The median age of board members who responded to the crowdsourcing survey was 50 to 54 years; 22% were aged 65 or older. The share of board members aged 65 or older varied slightly by the organization's geographic level and considerably by the organization's main activity.
The majority of board members who responded were women (59%). This share was higher for local non-profits and charities (63%) than for national organizations (54%). Women comprised the largest share of board members across most charities and non-profit organizations, regardless of the populations they serve and their main activities. That said, the share of board members who were women was highest in organizations mainly engaged in social services (67%); the environment (64%); education and research (63%); or law, advocacy and politics (60%) (correction). It was lowest among those engaged in sports and recreation (49%) (correction) or religion (40%).
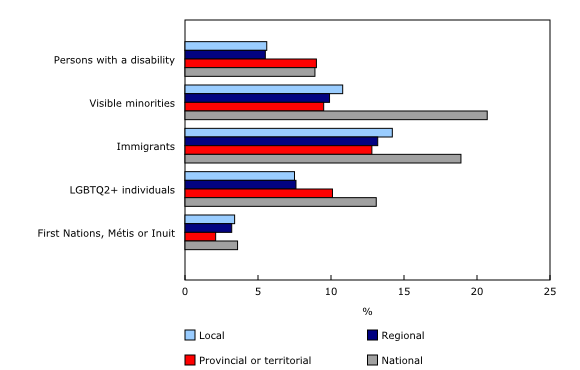
Among participating board members, 14% identified as being immigrants to Canada; 11% (correction) identified as belonging to a visible minority group; 8% (correction) identified as LGBTQ2+ individuals; 6% identified as persons with a disability; and 3% identified as First Nations, Métis or Inuit. Larger shares of board members in organizations operating at the national level reported these characteristics, as opposed to board members involved in a local organization.
Organizations mainly engaged in international (25%) (correction), religious (19%) (correction) or law, advocacy and politics (18%) (correction) activities had larger shares of participating board members who reported being immigrants. Similar patterns are observed among board members who identified as members of a visible minority group.
Participants who identified as LGBTQ2+ individuals comprised larger shares of board members in organizations mainly engaged in law, advocacy and politics (16%) (correction), or arts and culture (14%) (correction) than in other organizations. Participants who reported having a disability comprised larger shares of board members in organizations mainly engaged in law, advocacy and politics (12%) (correction), or health (8%) (correction). And participants who identified as Indigenous persons comprised larger shares of board members in organizations mainly engaged in law, advocacy and politics (6%).
Slightly larger shares of participants in diversity groups are involved in organizations with a written policy promoting board diversity
Participating board members in organizations with a written policy regarding the diversity of its board of directors were more likely to report being members of diverse population groups than those in organizations with no such policy. These differences generally ranged from to 2 to 4 percentage points.
In general, participating board members from diverse groups appear to comprise a larger share of board members in organizations serving those communities. For example, participants identifying as persons with a disability made up 6% to 7% of board members of organizations serving population groups other than disabled persons, but 8% of board members of organizations serving persons with disabilities. A similar pattern—where members of a community served by an organization are present on its board—is observed among organizations that serve Indigenous persons, the LGBTQ2+ community, newcomers or members of a visible minority group, and seniors.
Although these results come from a crowdsourcing initiative and therefore cannot be assumed to be representative of the non-profit sector as a whole, they do still provide a good glimpse into the composition of the boards of charities and non-profits. Findings from this survey provide important insights into what kinds of non-profits have higher representation of marginalized groups, and the potential impact of written policies on diversity in this vital sector of the Canadian economy.
Note to readers
For more information, please refer to 5344 - Diversity of Charity and Non-profit Boards.
Correction note
Some data were corrected on February 15, 2021.
Contact information
For more information, or to enquire about the concepts, methods or data quality of this release, contact us (toll-free 1-800-263-1136; 514-283-8300; STATCAN.infostats-infostats.STATCAN@canada.ca) or Media Relations (613-951-4636; STATCAN.mediahotline-ligneinfomedias.STATCAN@canada.ca).
- Date modified:


