Industrial research and development characteristics, 2018 (actual), 2019 (preliminary) and 2020 (intentions)
Archived Content
Information identified as archived is provided for reference, research or recordkeeping purposes. It is not subject to the Government of Canada Web Standards and has not been altered or updated since it was archived. Please "contact us" to request a format other than those available.
Released: 2020-12-09
Canadian businesses intend to spend $19.1 billion on in-house industrial research and development in 2020, a 2.5% increase from the preliminary estimates for 2019. However these intentions are based on data collected before the onset of COVID-19.
In 2018, Canadian businesses spent $19.5 billion on in-house industrial research and development (R&D) to develop or improve products or services. This spending marks a marginal increase from the $19.0 billion spent in 2017.
Makeup of R&D spending is largely unchanged
In-house R&D spending comprises current and capital expenditures. Current in-house expenditures, which include wages and salaries, services to support R&D, materials, and other costs, reached $18.5 billion, up from $18.0 billion in 2017. Wages and salaries accounted for more than two-thirds of all costs at $12.9 billion.
Capital expenditures, which include items such as software, land, buildings and structures, and equipment and machinery, decreased slightly from $1.1 billion in 2017 to $1.0 billion in 2018.
Businesses mostly self-fund their R&D activities
As in prior years, businesses funded over two-thirds ($13.4 billion) of the R&D they performed from internal operating funds. The remaining funding came from outside Canada ($3.3 billion), related businesses in Canada ($1.3 billion) and all levels of government in Canada ($1.2 billion).
R&D continues its shift to service industries, particularly software-related industries
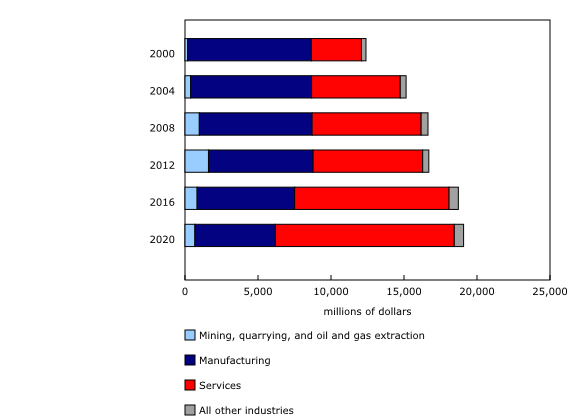
Historically, the manufacturing sector has performed the lion's share of industrial R&D, but this sector has seen its share decline in recent years. By 2008, manufacturing accounted for less than half of all industrial R&D spending. By 2012, service sector industries had surpassed the manufacturing sector to become the largest R&D performers. In 2020, service industries are projected to account for 64.2% ($12.3 billion) of total industrial R&D, more than double that of manufacturing, at 28.9% ($5.5 billion).
After peaking around $1.6 billion in 2012 and 2013, industrial R&D performance has shifted away from the mining, quarrying, and oil and gas extraction sector. Despite these declines, and decreases in spending in the manufacturing sector, increases in R&D spending in service sector industries have meant that overall business R&D spending has continued to rise.
In 2001, communications equipment manufacturers were the biggest R&D performers in Canada, collectively spending $3.2 billion. By 2011, R&D performed by this industry had fallen to $1.5 billion and by 2018 to $232 million. In 2020, the industry's R&D expenditures are projected to remain virtually unchanged at $248 million. In contrast, R&D expenditures in two key services industries, information and cultural industries (North American Industry Classification System [NAICS] 51) and computer systems design and related services (NAICS 5415), have grown dramatically. R&D performed by information and cultural industries (including software publishing) increased from $559 million in 2001 to $3.0 billion in 2018, and is projected to reach $3.1 billion in 2020. Similarly, R&D by computer systems design and related services increased from $1.1 billion in 2001 to $3.3 billion in 2018, with a projected growth to $3.6 billion in 2020.
Engineering and technology R&D shifts toward software
In 2018, engineering and technology R&D continued to predominate ($15.2 billion) all major fields of R&D expenditures in Canada, with spending far outweighing other major fields of R&D, including natural and formal sciences ($1.9 billion), medical and health sciences ($1.9 billion), agricultural sciences ($390 million) and social sciences and humanities ($39 million).
The driving factor within the engineering and technology industry was R&D related to software, which grew from $4.3 billion in 2015 to $6.5 billion by 2018.
Businesses are engaged mostly in experimental development
In 2018, businesses continued to focus heavily on experimental development ($16.1 billion), which draws upon knowledge gained through research and practical experience and directs it to produce or improve products or processes. Businesses were also engaged, though to a lesser extent, in research activities related to basic research ($1.0 billion) and applied research ($2.4 billion). These types of R&D involve acquiring knowledge that is often far from a marketable product or a process ready to be implemented in the business' activities.
Ontario and Quebec businesses perform three-quarters of business R&D
Provincial distribution of R&D performance reflected long-standing patterns and was virtually unchanged from 2017. Ontario ($9.2 billion) and Quebec ($5.3 billion) continued to report the largest share of in-house R&D, accounting for three-quarters of all in-house spending. British Columbia ($2.6 billion) and Alberta ($1.5 billion) together accounted for one-fifth of the total, while Manitoba and Saskatchewan accounted for 2.8% and Atlantic Canada for 2.0%.
Just over half of all R&D personnel are researchers
R&D activities are performed by R&D personnel in different occupations. In 2018, the number of R&D personnel rose slightly to 151,570 full-time equivalents (FTEs).
R&D activities were overseen by senior researcher managers (12,651 FTEs) and performed by researchers and scientists (85,075 FTEs), with assistance from technicians and technologists (34,778 FTEs) as well as administrative staff and other support staff (12,769 FTEs). Businesses also contracted out some services to on-site contractors (6,297 FTEs). The distribution of occupations for R&D personnel has generally remained stable across these occupation groups from 2014 to 2018.
Two-thirds of R&D personnel work for companies with $10 million or more in revenue, while the remaining one-third work for smaller companies. Industry-wise, almost two-thirds (65.1%) of R&D personnel work in the service industries. Two service sectors in particular—professional, scientific and technical services (NAICS 54, which includes computer systems design and related services, as well as research and development services) (36.9%), and information and cultural industries (NAICS 51) (14.5%)—accounted for just over half of all R&D personnel in Canada in 2018.
Outsourced R&D declined slightly in 2018
In 2018, businesses in Canada contracted out $4.7 billion for R&D, down slightly from $5.0 billion in 2017. Two-thirds of the contracted amounts were directed to Canadian businesses and organizations, with the largest share going to unaffiliated businesses ($1.5 billion), followed by affiliated businesses ($611 million). The funds sent outside of Canada included $1.1 billion to unaffiliated companies and $400 million to affiliated companies.
Canadian businesses performed more R&D than they outsourced it in all but three industries: real estate and rental and leasing, petroleum and coal production manufacturing, and pharmaceuticals and pharmacy supplies merchant wholesalers.
Sustainable Development Goals
On January 1, 2016, the world officially began implementation of the 2030 Agenda for Sustainable Development—the United Nations' transformative plan of action that addresses urgent global challenges over the next 15 years. The plan is based on 17 specific sustainable development goals.
Data on the characteristics of research and development in Canadian industry are an example of how Statistics Canada supports the reporting on the Global Goals for Sustainable Development. This release will be used in helping to measure the following goal:

Note to readers
These data are subject to revision.
Research and experimental development comprise creative and systematic work carried out to increase the stock of knowledge—including knowledge of humankind, culture and society—and to devise new applications for the available knowledge.
In-house research and development (R&D) expenditures refers to expenditures within Canada for R&D performed within the company by employees (permanent, temporary or casual) and self-employed individuals who are working on-site on the company's R&D projects.
On-site research and development (R&D) contractors are on-site personnel hired to perform specialized project-based R&D work under supervision and direction of the contracting organizations, and are considered separate from industrial R&D personnel.
Random Tabular Adjustment
The Random Tabular Adjustment (RTA) technique, which aims to increase the amount of data made available to users, while protecting the confidentiality of respondents was applied to the Annual Survey of Research and Development in Canadian Industry estimates.
Statistics Canada typically uses suppression techniques to protect sensitive statistical information. These techniques involve suppressing data points that can directly or indirectly reveal information about a respondent. This can often lead to the suppression of a large number of data points and significantly reduce the amount of available data.
Using RTA, Statistics Canada can identify sensitive estimates and randomly adjust their value rather than suppress them. The size of the adjustment is calculated to protect respondent confidentiality. After adjusting the value, the agency assigns a quality measure (A, B, C, D, or E) to the estimate to indicate the degree of confidence that users can have in its accuracy. Quality measures account for uncertainty related to sampling, non-response and RTA, when applied.
For more information on RTA, please refer to the blog article, "Random Tabular Adjustment is here!," now available as part of the StatCan Blog.
Contact information
For more information, or to enquire about the concepts, methods or data quality of this release, contact us (toll-free 1-800-263-1136; 514-283-8300; STATCAN.infostats-infostats.STATCAN@canada.ca) or Media Relations (613-951-4636; STATCAN.mediahotline-ligneinfomedias.STATCAN@canada.ca).
- Date modified:


