Urban public transit, September 2020
Archived Content
Information identified as archived is provided for reference, research or recordkeeping purposes. It is not subject to the Government of Canada Web Standards and has not been altered or updated since it was archived. Please "contact us" to request a format other than those available.
Released: 2020-11-30
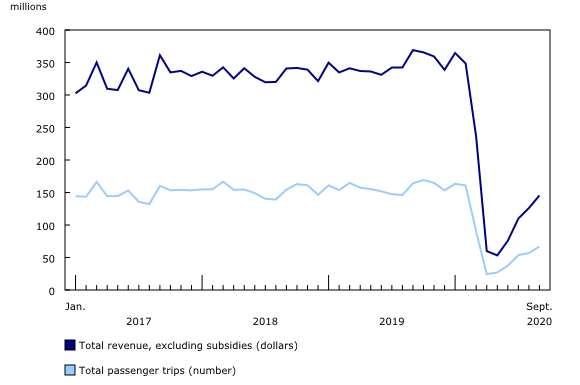
September is typically marked by a strong increase in urban transit traffic and revenues with the start of the school year and end of summer vacations. After transit fell drastically in March and April in response to COVID-19, the number of passenger trips has climbed steadily each month since to reach 67.0 million in September. Despite this steady improvement, ridership remained 59.1% lower than the same month in 2019.
One explanation for lower ridership is the large number of post-secondary students completing their studies online. Several transit agencies have reduced their service offerings to adapt to this situation. And with lower overall ridership, transit agencies continue to experience financial challenges. In September, total operating revenues (excluding subsidies) reported by these agencies were $145.5 million, down 60.6% from the same month last year.
With a second wave of the pandemic currently washing over the country, transit agencies will face ongoing challenges into October and perhaps for months to come. According to the Canadian Urban Transit Association, it is almost certain that ridership will not return to pre-COVID-19 levels for some time. Like other businesses, transit must work to restore customer confidence by adopting innovative technologies such as, for example, real-time crowd counters or predictors, information on vehicle locations and contactless payment options as well as more demand-responsive services.
Note to readers
Data for the most recent quarter are subject to revision. The data in this release are not seasonally adjusted.
This survey collects data on operating revenue (excluding subsidies) and the number of passenger trips from a panel of urban transit companies that represents at least 75% of revenues in each province and territory. Users should note that the panel is adjusted annually to maintain the 75% coverage and could differ slightly from what it was in the same month a year earlier.
Caution should also be used when comparing values prior to January 2017 with more recent values, as the number of sampled companies changed significantly. Data prior to January 2017 can be found in table 23-10-0078-01.
The Transportation Data and Information Hub, a web portal developed jointly by Statistics Canada and Transport Canada, provides Canadians with online access to comprehensive statistics and measures on the country's transportation sector.
Contact information
For more information, or to enquire about the concepts, methods or data quality of this release, contact us (toll-free 1-800-263-1136; 514-283-8300; STATCAN.infostats-infostats.STATCAN@canada.ca) or Media Relations (613-951-4636; STATCAN.mediahotline-ligneinfomedias.STATCAN@canada.ca).
- Date modified:


