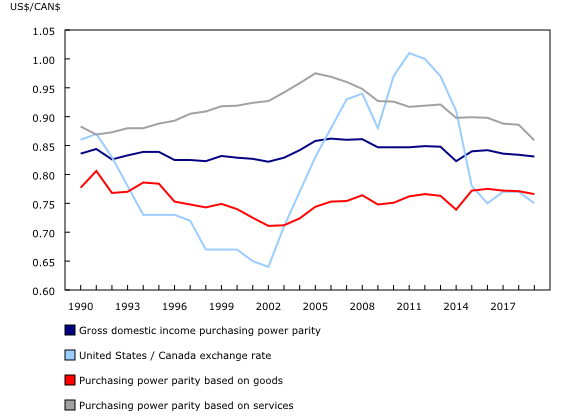
Purchasing power parities, 2019
Archived Content
Information identified as archived is provided for reference, research or recordkeeping purposes. It is not subject to the Government of Canada Web Standards and has not been altered or updated since it was archived. Please "contact us" to request a format other than those available.
Released: 2020-07-28
Purchasing power parities between Canada and the United States
In 2019, the purchasing power of a Canadian dollar was US$0.83, down 0.4% from 2018. The estimate indicates that the equivalent goods and services bought by CAN$100 in Canada would require US$83 to purchase in the United States. The annual exchange rate of a Canadian dollar fell from US$0.77 in 2018 to US$0.75 in 2019.
Purchasing power parity higher than average long-term exchange rate
From 1990 to 2019, average purchasing power parity (PPP) was US$0.84, while the average market exchange rate was US$0.81. While the PPP tends to be stable, the exchange rate is highly volatile. The annual exchange rate fell to US$0.64 in 2002 and peaked at US$1.01 in 2011. From 1990 to 2019, the PPP ranged from US$0.82 to US$ 0.86.
Estimates of PPP reflect the relative prices of all products included in the gross domestic product (GDP) of each country. The market exchange rate, on the other hand, is determined by the demand and supply of currencies in the foreign exchange market. Because of currency speculation and capital flows, the demand and supply of currencies can change rapidly.
Purchasing power parity facilitates national comparisons
In 2019, Canada's nominal GDP was CAN$2.3 trillion and the US nominal GDP was US$21.4 trillion. PPP-adjusted GDP for the United States was 11 times larger than that of Canada. In 2019, PPP-adjusted per capita GDP in Canada was about US$50,600. This was 10% higher than the exchange-rate-converted per capita GDP, and so reflected a higher living standard than that indicated by the market exchange rate.
Because PPP-adjusted income better reflects the standard of living, international institutions, such as the United Nations and the World Bank, use it to rank countries.
Impacts of COVID-19
The impacts of the COVID-19 pandemic on the relative prices of goods are likely to be minimal, because the Canada-US border remained open for trading purposes. As well, the relative prices of services, such as health care and education, tend to be stable. Consequently, purchasing power parities between Canada and the United States are expected to remain similar.
Goods more expensive in Canada, but prices of services more similar
From 1990 to 2019, the average PPP of goods (such as cars and computers) was US$0.76 and the average PPP of services (such as health care and education, after accounting for both private and public costs) was US$0.91. This indicates that goods were relatively more expensive in Canada. Transportation, taxes, and trade margins are generally higher in Canada.
Note to readers
The Canada-US purchasing power parity (PPP), disseminated through tables 36-10-0365-02 and 36-10-0367-02, could differ from the Organisation for Economic Co-operation and Development's multilateral PPP, in table 36-10-0100-01. The differences and a detailed explanation of the concepts and methods applied to calculate PPP are available in the article "Purchasing Power Parities between the United States and Canada: Concepts and methods," which is part of Income and Expenditure Accounts Technical Series (13-604-M).
Products
The document, "Satellite accounting in Canada," which is part of Latest Developments in the Canadian Economic Accounts (13-605-X), is now available.
The Economic accounts statistics portal, accessible from the Subjects module of our website, features an up-to-date portrait of national and provincial economies and their structure.
The User Guide: Canadian System of Macroeconomic Accounts (13-606-G) is also available.
The Methodological Guide: Canadian System of Macroeconomic Accounts (13-607-X) is also available.
Contact information
For more information, or to enquire about the concepts, methods or data quality of this release, contact us (toll-free 1-800-263-1136; 514-283-8300; STATCAN.infostats-infostats.STATCAN@canada.ca) or Media Relations (613-951-4636; STATCAN.mediahotline-ligneinfomedias.STATCAN@canada.ca).
- Date modified:


