Food availability, 2019
Archived Content
Information identified as archived is provided for reference, research or recordkeeping purposes. It is not subject to the Government of Canada Web Standards and has not been altered or updated since it was archived. Please "contact us" to request a format other than those available.
Released: 2020-05-28
The food available for consumption in Canada in 2019 suggests growing consumer demand for healthier food options, leading to the higher availability of a variety of fruits, vegetables and poultry, and the lower availability of sugar and processed foods and drinks.
In March 2020, the food available for consumption in Canada began to change in the wake of COVID-19. The data released today will provide a valuable benchmark to better understand the evolving food market throughout 2020.
Food availability is the amount of food that is physically present in a country for human consumption.
More fresh fruit and frozen fruit and vegetables are available, compared with a decade ago
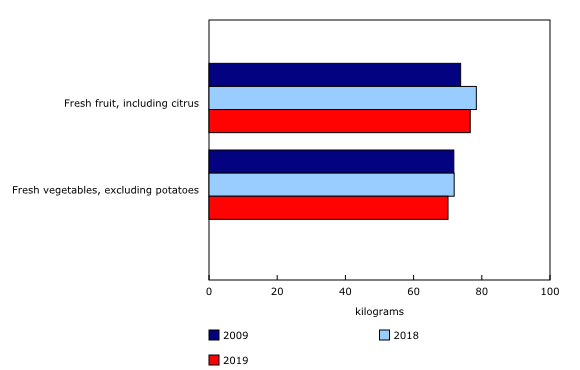
Total fresh fruit available, including citrus, rose 3.8% to 76.6 kilograms per person from 2009 to 2019. This was led by fresh fruit production (+20.2%) and fresh fruit imports (+16.6%).
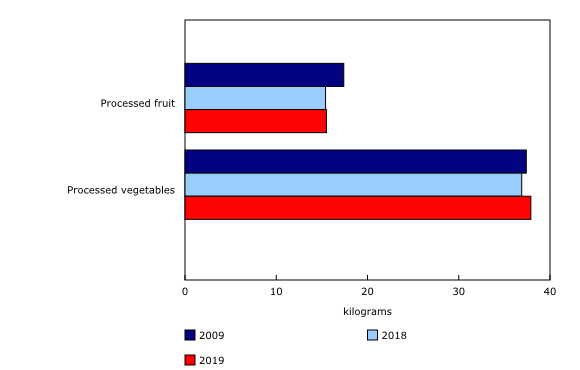
Total processed fruit available for consumption remained relatively stable (+0.5%) from 2018—at 15.5 kilograms of fresh equivalent per person in 2019—but was down 10.5% from 2009. However, the availability of total frozen fruits was up from both 2018 (+11.7%) and 2009 (+59.1%).
The availability of total frozen vegetables (fresh equivalent) increased by 10.4% from 2018, and by 10.0% from a decade earlier, to 8.4 kilograms in 2019. Total processed vegetables available for consumption (fresh equivalent) increased by 2.7% from 2018, and by 1.2% from 2009, to 37.9 kilograms per person in 2019.
Total fresh vegetables available for consumption, excluding potatoes, decreased 2.6% to 70.1 kilograms per person from 2018 to 2019. This was 2.3% lower compared with 2009.
Chicken continues to lead meat availability
The availability of total poultry for consumption (including chicken, turkey and stewing hen) was relatively stable (+0.02%) from 2018—at 26.0 kilograms of boneless weight per person in 2019—but was up 10.1% from 2009. According to "Poultry and egg statistics," released in The Daily on May 27, 2020, poultry production rose 1.7% from 2018—the 10th consecutive annual increase, and was up by almost one-quarter (+24.0%) from a decade earlier.
Chicken led the way, up 12.7% from a decade earlier, to 21.1 kilograms available in 2019. The increase in poultry availability for consumption may be because of lower poultry prices and the perceived health benefits of poultry.
The availability of red meat for consumption declined 1.6% to 34.0 kilograms of boneless weight per person from 2018 to 2019, mainly because of lower beef availability (-4.6%). In contrast, pork availability rose 2.1% from 2018. Beef availability was down 15.4% from 2009, to 15.5 kilograms, while pork availability was down 6.0% to 16.2 kilograms of boneless weight per person.
The amount of eggs available for consumption continues to increase
In 2019, the amount of eggs available for consumption increased 1.3% from 2018, to 21.4 dozen eggs per person, up by more than one-third (+33.6%) from a decade earlier. Total egg production rose 32.7% to 822.4 million dozen eggs. Canada's Food Guide recommends eggs as a source of protein. Eggs are low in saturated fat and do not contain trans fats. They are also one of the least expensive protein sources.
Total cheese and cream availability continues to increase, while total fluid milk availability decreases
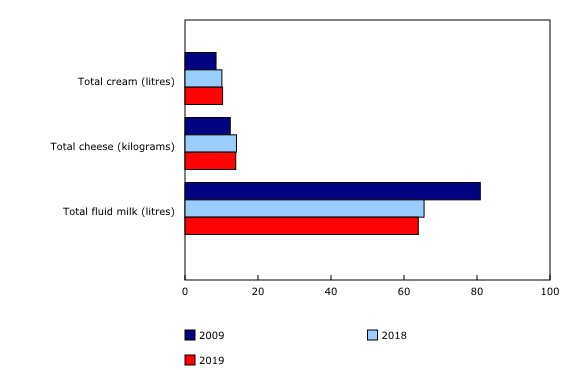
The amount of total milk available for consumption decreased 2.5% from 2018, to 63.9 litres per person in 2019, and was down 21.0% from 2009. The decline in total milk available for consumption over the past decade was partly attributable to the availability of skim milk, which fell by more than half (-56.6%) from 2009, to 3.7 litres per person in 2019, because of lower production.
In contrast, the amount of total cheese available for consumption increased 11.6% to 13.9 kilograms from 2009 to 2019. Production and imports of cheddar cheese and variety cheeses were both up from a decade earlier, while the availability of processed cheese was down. The shift away from processed cheese toward other cheeses may be the result of consumers choosing healthier food options.
The amount of total cream available for consumption—including table cream, sour cream, whipping cream and cereal cream—was up 21.6% to 10.3 litres from 2009. In contrast, the availability of ice cream (-23.9%) and sherbet (-15.4%) was down from 2009 to 2019.
Less wheat flour and more rolled oats are available, compared with a decade ago
The volume of wheat flour available for consumption decreased 4.9% from 2009, but increased for the second consecutive year—up 3.7% from 2018, to 60.2 kilograms per person. Rolled oats continued their upward climb in 2019, up compared with both 2018 (+14.6%) and 2009 (+349.5%).
Availability of refined sugar and sugary drinks continues to decline
The amount of refined sugar available for consumption continued to decline, down 6.3% from a decade earlier and 12.1% lower compared with two decades ago.
The availability of most juices for consumption has also been decreasing. The lower demand for juice may be because of health-conscious consumers leaning away from sugary drinks.
Soft drink availability was down 3.9% from 2018, to 56.1 litres per person in 2019, and over one-third (-36.5%) lower compared with 2009. The decrease in soft drink availability was also likely because of consumers choosing drinks that contain less sugar.
Ale and wine availability declines, while availability of ciders, coolers and other refreshment beverages rises
In 2019, the availability of ale declined 1.7% year over year to 58.8 litres per person, down 14.7% from 2009. Wine availability was 13.5 litres per person, down 3.9% from 2018 on higher exports (+16.0%). Wine (+12.6%), spirits (+0.5%), and ciders, coolers and other refreshment beverages (+91.1%) all saw increases in availability compared with a decade earlier.
Note to readers
Data on food availability per person for selected products and on the supply and disposition of these products are now available for 2019.
Data presented in this release are compiled from a variety of sources, both survey and administrative, from within Statistics Canada and from other sources, including provincial and federal government departments, growers' associations, and marketing boards.
The food availability data series is the result of a partnership between Agriculture and Agri-Food Canada and Statistics Canada.
Data were also pulled from "Poultry and egg statistics," released in The Daily on May 27, 2020, and the Consumer Price Index (table 18-10-0002).
Portal
The Agriculture and food statistics portal, accessible from the Subjects tab of the Statistics Canada website, provides users with a single point of access to a variety of information related to agriculture and food.
Products
The infographic "Are Canadians eating healthy foods?" is now available as part of Statistics Canada — Infographics (11-627-M).
Contact information
For more information, or to enquire about the concepts, methods or data quality of this release, contact us (toll-free 1-800-263-1136; 514-283-8300; STATCAN.infostats-infostats.STATCAN@canada.ca) or Media Relations (613-951-4636; STATCAN.mediahotline-ligneinfomedias.STATCAN@canada.ca).
- Date modified:


