Cancer prevalence, 2015
Archived Content
Information identified as archived is provided for reference, research or recordkeeping purposes. It is not subject to the Government of Canada Web Standards and has not been altered or updated since it was archived. Please "contact us" to request a format other than those available.
Released: 2019-12-04
1,730 per 100,000 people
2015
Cancer touches the lives of many Canadians. One way to monitor how Canadians are impacted by cancer is to measure the proportion of living Canadians who have been diagnosed with cancer over a specific time period. This estimate, also called cancer prevalence, helps Canadians understand not only the number of people living with a cancer diagnosis, but also differences in prevalence by sex, age and other factors. Cancer prevalence also helps Canadians monitor changes in rates of cancer in Canada over time.
While cancer may start in one part of the body and spread to others, cancer prevalence reflects the primary cancer diagnosis (the original or first tumour in the body). The number of cases of cancer in Canada at any given time is influenced by a number of factors including the number of new cases diagnosed every year (incidence), and patient survival. Cancer prevalence in Canada therefore may increase when the number of new cases being diagnosed increases, when patients survive longer with their cancer, or when both occur.
Among people living in Canada on January 1, 2015, excluding Quebec (see note to readers), there were 474,050 people diagnosed with cancer from 2010 to 2014 (1,730 cases for every 100,000 people).
The most common, or 'prevalent' cancers diagnosed were breast (17.0% of all cancer cases), prostate (16.2%), colorectal (12.3%), lung and bronchus (6.0%) and bladder (5.4%). Together these cancers accounted for over 55% of all cases.
Cancer prevalence by sex
There was a slightly higher five-year cancer prevalence among females (237,920 cases or 50.2%) than males (236,125 cases or 49.8%), driven, for the most part, by breast cancer.
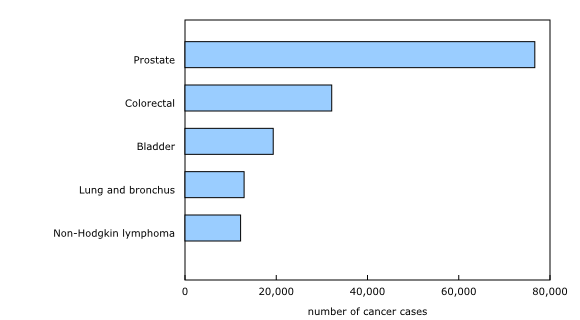
In the case of both males and females, the five most common cancers by sex accounted for close to two in three cancer cases over this time period. Among males, prostate was the most common cancer (32.5% of all male cancer cases), followed by colorectal (13.6%), bladder (8.2%), lung and bronchus (5.5%) and non-Hodgkin lymphoma (5.2%). Among females, breast was the most prevalent cancer, representing one-third of all female cancer cases (33.6%), followed by colorectal (10.9%), uterine (8.0%), thyroid (7.1%) and lung and bronchus cancer (6.6%).
Cancer prevalence by age
Cancer prevalence in Canada varies greatly by age. A large proportion of people living with cancer in Canada on January 1, 2015, were aged 60 and older. When considering all types of cancer combined, the five-year cancer prevalence in this age group accounted for 69.1% of all cases in Canada (327,400 out of 474,050). The top five cancers in this age group were prostate (20.1%), breast (15.0%), colorectal (13.8%), lung and bronchus (7.4%) and bladder (6.6%). For those under the age of 60, however, the five most common cancers were different: breast (21.3%), thyroid (10.3%), colorectal (8.9%), prostate (7.4%) and melanomas of the skin (6.1%) accounted for more than half of the five-year prevalence estimate for this age group.
Prevalence trends over time
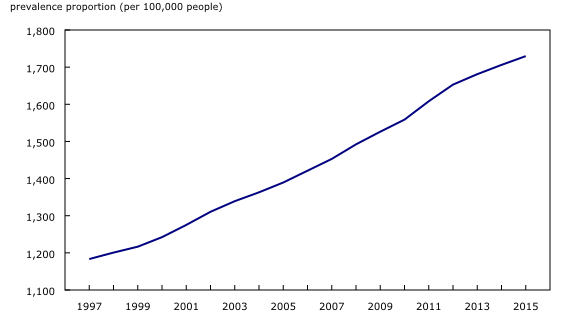
Five-year cancer prevalence has increased over time in Canada. This trend may be due to an increase in the number of diagnosed cancer cases as well as longer survival times for some cancer patients.
Note to readers
Data are from the Canadian Cancer Registry (CCR), with mortality follow-up to December 31, 2014 through record linkage to the Canadian Vital Statistics Death Database and the income tax file known as the T1 Personal Master File.
Cancer incidence data for Quebec have not been submitted to the CCR since the 2010 diagnosis year. Cancer prevalence estimates for Canada, excluding Quebec, have been generated for all prevalence years from 1994 to 2015 because the series for Canada only ranges from 1994 to 2011. All reference dates coincide with January 1st of the prevalence year.
The estimates presented in this table are based on tumour counts, not on patient counts, which implies that the estimates can exceed the number of patients since more than one primary cancer type can be diagnosed within the same patient.
The geographic information in this table refers to the province or the territory where the tumour was diagnosed, whereas the age of the patient is not measured at the time of diagnosis but rather reflects the attained age group at the end of the prevalence duration.
For all cancer types, only malignant tumours were included in the prevalence counts, with the exception of bladder cancer counts that also included in situ tumours.
Contact information
For more information, or to enquire about the concepts, methods or data quality of this release, contact us (toll-free 1-800-263-1136; 514-283-8300; STATCAN.infostats-infostats.STATCAN@canada.ca) or Media Relations (613-951-4636; STATCAN.mediahotline-ligneinfomedias.STATCAN@canada.ca).
- Date modified:


