Gross domestic product, income and expenditure, third quarter 2019
Archived Content
Information identified as archived is provided for reference, research or recordkeeping purposes. It is not subject to the Government of Canada Web Standards and has not been altered or updated since it was archived. Please "contact us" to request a format other than those available.
Released: 2019-11-29
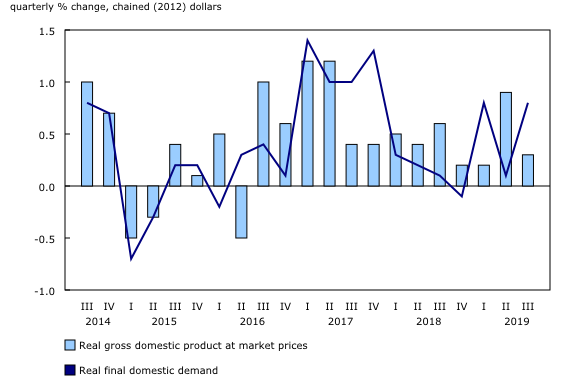
Real gross domestic product (GDP) grew 0.3%, following a 0.9% increase in the second quarter. Third quarter growth was led by higher business investment and increased household spending, boosting final domestic demand by 0.8%.
Expressed at an annualized rate, real GDP advanced 1.3% in the third quarter. In comparison, real GDP in the United States grew 1.9%.
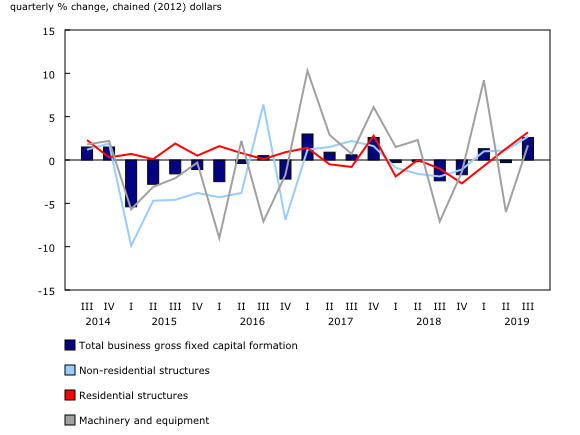
Business investment rose 2.6% in the third quarter, the fastest pace since the fourth quarter of 2017. Growth in household spending accelerated to 0.4%, after rising 0.1% in the second quarter. These increases were moderated by a 0.4% decline in exports, while imports were flat.
Non-farm business inventories were drawn down by $550 million in the third quarter, and the economy-wide stock-to-sales ratio hovered at 0.84. Cannabis inventories contributed to the $4.9 billion accumulation of farm inventories.
Housing investment accelerates
Housing investment rose 3.2%, the fastest pace since the first quarter of 2012. The increase was driven by both new home construction (+3.3%)—mostly single-detached homes in Ontario—and higher ownership transfer costs (+8.7%) from increased resale activities in British Columbia and Ontario.
Business investment grows
Business investment in non-residential buildings was up 1.4%, after rising 1.0% in the second quarter. Growth in business investment in engineering structures accelerated to 3.1%, the fastest pace since the third quarter of 2016. Business investment in machinery and equipment rose 1.7%, after falling 6.0% in the second quarter, while investment in intellectual property products rose 1.5%, matching the previous pace of growth.
Moderate growth in household spending
Household spending rose 0.4% in the third quarter, after edging up 0.1% in the second quarter. Outlays on durable goods rebounded 0.4%, after declining by the same rate in the previous quarter. The increase was largely driven by purchases of new trucks, vans and sport utility vehicles (+4.9%)—the sharpest rise since the third quarter of 2015.
Outlays on semi-durable goods rose 0.5%, and outlays on non-durable goods advanced 0.3%. Growth in household spending on services, representing over half of total household spending, accelerated to 0.4%, after rising 0.2% in the second quarter.
Export volumes fall
Export volumes declined 0.4%, after rising 3.1% in the second quarter. Notable downturns occurred in exports of non-metallic minerals (-15.2%) and farm and fishing products (-4.5%). These declines were partly offset by higher exports of metal ores and concentrates (+11.6%), and clothing and footwear products (+17.3%). Exports of services were essentially unchanged.
Import volumes remained flat in the third quarter, following a 0.9% drop in the second quarter. Increases in imports of basic chemical products (+5.4%), and pharmaceutical and medicinal products (+5.2%) were offset by declines in imports of passenger cars and light trucks (-2.2%) and industrial machinery, equipment and parts (-1.5%). Imports of services further declined 0.4%, after a 1.8% drop in the second quarter.
Terms of trade decline
The third quarter decline in export prices (-1.5%), largely owing to a 10.9% drop in prices of exported crude oil and bitumen, was twice that of import prices (-0.7%). Consequently, the terms of trade—the ratio of the price of exports to the price of imports—dropped in the third quarter (-0.9%), offsetting the 0.8% gain in the second quarter.
The GDP implicit price index, which reflects the overall price of domestically produced goods and services, edged up 0.1%.
Corporate earnings fall while household disposable income increases
Gross operating surplus of corporations fell 2.4% (nominal terms) in the third quarter, after rising 4.1% in the second quarter. Compensation of employees rose 1.3%, after increasing 1.5%. Growth in compensation of employees was led by service-producing industries (+1.5%).
Household disposable income rose 0.9%, while nominal household spending increased 0.6%, resulting in an increase in household savings. The household saving rate rose to 3.2%.
Sustainable development goals
On January 1, 2016, the world officially began implementing the 2030 Agenda for Sustainable Development—the United Nations' transformative plan of action that addresses urgent global challenges over the next 15 years. The plan is based on 17 specific sustainable development goals.
Data on gross domestic product, income and expenditure are an example of how Statistics Canada supports the reporting on the global sustainable development goals. This release will be used to measure the following goals:


Note to readers
This release incorporates the 2016 benchmark supply and use tables. This release reflects the integration of historical updates to exports, imports and final household spending on travel services. As a result, Canada's real gross domestic product (GDP) growth rate was revised down from 1.1% to 1.0% in 2016, and revised up from 3.0% to 3.2% in 2017. More up-to-date information reinforced the published estimates of weaker growth in 2016 and stronger growth in 2017 than originally reported, and estimates differ slightly from those published in the second quarter of 2019.
Percentage changes for expenditure-based statistics (such as household spending, investment and exports) are calculated from volume measures that are adjusted for price variations. Percentage changes for income-based statistics (such as compensation of employees and operating surplus) are calculated from nominal values; that is, they are not adjusted for price variations.
There are two ways of expressing growth rates for GDP and other time series:
- Unless otherwise stated, growth rates represent the percentage change in the series from one quarter to the next, such as from the second quarter of 2019 to the third quarter of 2019.
- Quarterly growth can also be expressed at an annual rate by using a compound growth formula, similar to the way in which a monthly interest rate can be expressed at an annual rate. This growth rate is cited for comparisons with the United States. Both formulas represent the latest period-to-period quarterly growth.
For information on seasonal adjustment, see Seasonally adjusted data – Frequently asked questions.
For more information on gross domestic product, see the video "What is Gross Domestic Product (GDP)?"
Revisions
Data on GDP for the third quarter have been released along with revised data from the first quarter of 2016. These data incorporate new and revised data, as well as updated data on seasonal trends.
Real-time tables
Real-time tables 36-10-0430-01 and 36-10-0431-01 will be updated on December 9.
Next release
Data on GDP by income and expenditure for the fourth quarter will be released on February 28.
Products
The document, "The 2016 to 2018 revisions of the Income and Expenditure Accounts," which is part of the Latest Developments in the Canadian Economic Accounts (13-605-X) is now available.
The data visualization product "Infrastructure Statistics Hub," part of the series Statistics Canada – Data Visualization Products (71-607-X), is now available.
The product Cannabis Stats Hub (13-610-X) is now available.
The Economic Accounts Statistics portal, accessible from the Subject module of our website, features an up-to-date portrait of national and provincial economies and their structure.
The User Guide: Canadian System of Macroeconomic Accounts (13-606-G) is available.
The Methodological Guide: Canadian System of Macroeconomic Accounts (13-607-X) is available.
Contact information
For more information, or to enquire about the concepts, methods or data quality of this release, contact us (toll-free 1-800-263-1136; 514-283-8300; STATCAN.infostats-infostats.STATCAN@canada.ca) or Media Relations (613-951-4636; STATCAN.mediahotline-ligneinfomedias.STATCAN@canada.ca).
- Date modified:


