Canadian Classification of Functions of Government, 2018
Archived Content
Information identified as archived is provided for reference, research or recordkeeping purposes. It is not subject to the Government of Canada Web Standards and has not been altered or updated since it was archived. Please "contact us" to request a format other than those available.
Released: 2019-11-27
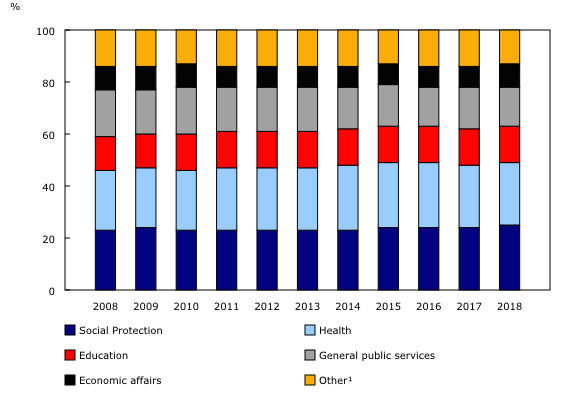
Almost two-thirds of the $753.8 billion spent by all levels of government nationally were directed towards social protection, health care and education in 2018. Spending on social protection (+5.4%) grew at the fastest pace in 2018, followed by spending on education (+2.8%) and health care (+1.5%).
Social protection is the largest expense of the Canadian general government
The consolidated Canadian general government—that is, the federal, provincial, territorial and local governments and other government entities combined—increased spending on social protection by 5.4% in 2018 to $184.7 billion. This accounted for almost one-quarter (24.5%) of total government spending.
Social protection includes programs such as Old Age Security, family benefits, disability payments and unemployment benefits. The increase in 2018 was largely because of higher spending on disability and sickness (+$3.2 billion) and Old Age Security (+$3.1 billion). Higher spending on housing (+$1.9 billion) and the protection of vulnerable persons (+$1.8 billion) also contributed to the increase.
Health care spending rose 1.5% to $178.7 billion, accounting for 23.7% of total government spending. This was equivalent to $4,778 per Canadian. The increase was because of higher spending on hospital services, which rose 2.1% to $117.4 billion.
Spending on education rose 2.8% from 2017 to $104.2 billion. Excluding public debt transactions, which are considered a general public service, education was the third largest expense in 2018, accounting for 13.8% of total government spending. Although spending was up for every level of education, college education contributed the most to the increase, rising 11.1% to $14.5 billion. This was partially attributable to contract settlements in Ontario and Nova Scotia.
Health accounts for nearly one-third of provincial, territorial and local government spending
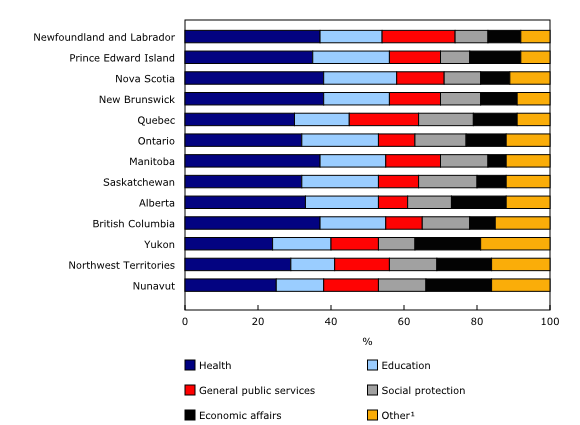
Health (32.9%) remained the largest expense among provincial, territorial and local governments combined, accounting for nearly one-third of their total spending in 2018.
On a per capita basis, health expenses were the highest provincially in Newfoundland and Labrador ($6,234), Manitoba ($5,397) and New Brunswick ($5,390). The lowest health expenses per capita were in Ontario ($4,284), Quebec ($4,510) and British Columbia ($4,649).
Hospital services (70.8%) accounted for over two-thirds of provincial health spending, on average. Outpatient services accounted for 12.8% of provincial health spending, followed by medical products and appliances (6.2%) and public health services (4.9%).
Primary and secondary education account for almost two-thirds of total provincial educational spending, on average
Spending on primary and secondary education (62.6%) was the largest educational expense for every province, accounting for almost two-thirds of total educational expenses, on average. University education (24.6%) accounted for one-quarter of total educational expenses among the provinces, while spending on college education accounted for 11.1%, on average.
All levels of government combined spent $39.6 billion on university and college education in 2018. Universities and colleges also received $15.4 billion in tuition and school fees.
On a per capita basis, the government spent $2,784 per Canadian on education in 2018. By province, Saskatchewan ($3,299), Alberta ($3,094), and Newfoundland and Labrador ($2,888) spent the most on education on a per capita basis, while British Columbia ($2,169), Quebec ($2,250) and New Brunswick ($2,542) spent the least.
Social protection spending up by almost one-fifth in British Columbia
Among provincial and local governments, spending on social protection was highest in Saskatchewan ($2,462) and Quebec ($2,246) on a per capita basis, and lowest in Prince Edward Island ($1,079) and Nova Scotia ($1,369).
The higher levels of spending in Saskatchewan were largely because of extensive sickness, disability and survivor benefit coverage provided by the province's compulsory public auto insurance program. In Quebec, the higher levels were mostly related to higher spending on family and children because of Quebec's subsidized universal child care program.
British Columbia reported the fastest growth in social protection spending in 2018, up 18.4% to $8.1 billion ($1,611 per person). This increase was largely a result of grants associated with the Building BC program, which provides affordable housing. Broad funding increases for a variety of other social programs also contributed to the gain.
Ontario leads growth in economic affairs spending
Total government spending on economic affairs—that is, spending on economic activities such as agriculture, energy, mining or transport—increased 16.2% to $68.3 billion in 2018, equal to $1,827 per Canadian. This increase was largely attributable to higher spending on energy (+$5.0 billion), transport (+$2.8 billion) and general economic affairs (+$1.8 billion).
The increase in total government spending on energy was led by the provincial and local governments of Ontario (+$3.3 billion), and was partially attributable to the Electricity Price Mitigation program, which helps reduce electricity costs. Higher spending by the federal government (+$1.1 billion) on energy programs also contributed to the increase.
On a per capita basis, provincial spending on economic affairs was highest in Alberta ($2,309), Prince Edward Island ($1,786) and Quebec ($1,708), and was lowest in Manitoba ($739), British Columbia ($872) and Nova Scotia ($1,115).
High costs for Arctic water and northern lights
On a per capita basis, water supply was the most expensive in Canada's North—local governments in Nunavut spent $1,293 per person on water supply in 2018. This was 22 times the amount in Prince Edward Island ($58 per person), which spent the least among jurisdictions in Canada. The large difference was partially because water is trucked into many communities in Nunavut, while the population in Prince Edward Island that lives outside urban centres often uses wells as their source of drinking water.
In 2018, street lighting was the most expensive for local governments in the Northwest Territories, costing $67 per person. This was 5.6 times the cost for local governments in Quebec ($12 per person), which had the lowest cost of any jurisdiction. Higher general operating expenses in the Northwest Territories and lower energy costs in Quebec were likely contributing factors for this difference.
Spending quirks at the local level
Government spending is often dictated by jurisdictional responsibilities. In most jurisdictions in Canada, for example, ambulance services are a provincially administered responsibility. In Ontario, however, municipalities are responsible for land-ambulance services. As a result, municipalities in Ontario ($1.3 billion) spent the most on outpatient services among local governments across Canada in 2018. A provincial funding formula provides offsetting funding for a portion of these expenses.
Prince Edward Island was the lone province with provincially run waste collection. As a result, local government waste management expenditures in Prince Edward Island ($1 million) were significantly lower than those of every other province in 2018. This was because Island Waste Management Corporation, a provincial government Crown corporation, administers garbage collection on the island.
Sustainable development goals
On January 1, 2016, the world officially began implementation of the 2030 Agenda for Sustainable Development—the United Nations' transformative plan of action that addresses urgent global challenges over the next 15 years. The plan is based on 17 specific sustainable development goals.
The Canadian Classifications of Functions of Government is an example of how Statistics Canada supports the reporting on the global goals for sustainable development. This release will be used in helping to measure the following goals:


Note to readers
Note to readers The Canadian Classification of Functions of Government (CCOFOG) organizes government expenses into their main socioeconomic functions. This information provides an important picture of how governments spend money, and the role governments play in delivering services.
CCOFOG is a variant of the international functional expenditure classification that was developed by the Organisation for Economic Co-operation and Development (OECD). CCOFOG replaced the Financial Management System that was used by Statistics Canada until 2008.
New preliminary estimates for a lower-level classification of functions of government are now available for local governments for 2016 to 2018. The additional details are useful for examining structural differences in the way jurisdictions delineate responsibilities between levels of government in Canada. In some limited cases, where a service is nearly universally administered by local governments across jurisdictions (e.g., water supply, street lighting, fire protection, recreation), it can be used for comparative purposes.
Further expansion of the CCOFOG program is planned. Future data improvements may include the functionalization of capital expenditures and the consumption of fixed capital. Currently, CCOFOG data exclude the acquisitions of non-financial assets and consumption of fixed capital expenses.
The consolidated provincial, territorial and local government (PTLG) estimates are often used for provincial and territorial comparisons. These estimates combine provincial and territorial governments, health and social service institutions, universities and colleges, municipalities and other local public administrations, and school boards. Importantly, this aggregation removes interparty transactions. The PTLG aggregation is most often used for comparability purposes since there can be different delineations of responsibilities between levels of government in various jurisdictions.
The consolidated Canadian general government estimates combine the federal government with PTLG data. They exclude data for the Canada Pension Plan and the Quebec Pension Plan, and for federal and provincial government business enterprises.
The constitutional framework of PTLGs in the territories differs from the framework in the provinces. This leads to differences in the roles and financial authorities of government. These differences, as well as other geographic, demographic and socioeconomic dissimilarities between the North and the rest of Canada, give rise to marked disparities in government finance statistics.
Since the size of PTLG estimates varies significantly across jurisdictions because of different population sizes, per capita data are used for expense comparisons. Per capita data are based on population estimates for Canada, the provinces and the territories, available in table 17-10-0009-01.
17-10-0009-01. Annual data correspond to the end of the fiscal year closest to December 31. For example, data for the federal government fiscal year ending on March 31, 2019 (fiscal year 2018/2019) are reported as the 2018 reference year.
Products
The Canadian Classification of Functions of Government classification structure and descriptions are now available under the related information module of our website.
Additional information can be found in the Latest Developments in the Canadian Economic Accounts (13-605-X). The User Guide: Canadian System of Macroeconomic Accounts (13-606-G) is also available. This publication has been updated with Chapter 9. Government sector accounts in the Canadian System of Macroeconomic Accounts.
Contact information
For more information, or to enquire about the concepts, methods or data quality of this release, contact us (toll-free 1-800-263-1136; 514-283-8300; STATCAN.infostats-infostats.STATCAN@canada.ca) or Media Relations (613-951-4636; STATCAN.mediahotline-ligneinfomedias.STATCAN@canada.ca).
- Date modified:


