Farm income, 2018 (revised data)
Archived Content
Information identified as archived is provided for reference, research or recordkeeping purposes. It is not subject to the Government of Canada Web Standards and has not been altered or updated since it was archived. Please "contact us" to request a format other than those available.
Released: 2019-11-26
Realized net farm income falls sharply as expenses rise
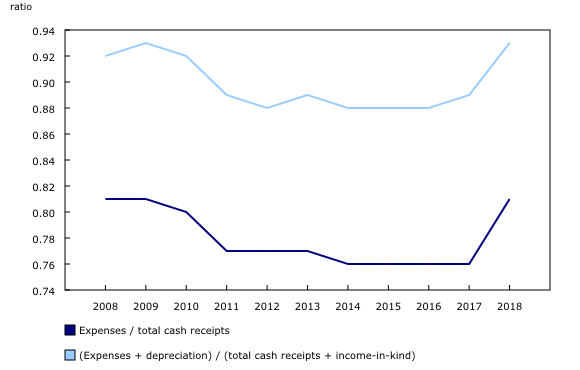
Realized net income of Canadian farmers declined 41.0% from 2017 to $4.2 billion in 2018 on sharply higher costs and a slight increase in receipts. It was the largest percentage decrease in realized net income since 2006 and followed a 2.8% decline in 2017.
Realized net income is the difference between a farmer's cash receipts and operating expenses, minus depreciation, plus income in kind.
New Brunswick was the sole province to post a gain (+7.7%), attributable to increased cannabis and potato production. Lower canola receipts contributed to pushing realized net income in Alberta down 68.0%, accounting for more than one-third of the national decrease.
Farm cash receipts in 2018 remain close to 2017 levels
Farm cash receipts, which include crop and livestock revenues as well as program payments, edged up 0.3% in 2018 to $62.4 billion—the smallest increase since 2010.
Higher receipts in six provinces were mostly offset by decreases in the three Prairie provinces. Receipts in Newfoundland and Labrador were virtually unchanged.
Market receipts were up 0.7% to $60.2 billion in 2018, as a small rise in crop receipts more than compensated for a slight decline in livestock receipts. Market receipts are the product of price and marketings. Marketings are quantities sold, using various units of measure.
Higher wheat and cannabis receipts lead to an uptick in crop receipts
Crop revenue rose 1.3% from a year earlier to $35.1 billion in 2018, following a 1.1% increase in 2017. Higher wheat (excluding durum) and cannabis revenues more than offset lower canola receipts.
Wheat (excluding durum) receipts grew 11.6% as both prices and marketings rose. Exports increased in 2018 due in part to a near tripling of shipments to China.
The revenue from licensed producers of cannabis grew 198.4% to $564.1 million in 2018, as the recreational use of cannabis became legal in October.
Also contributing to the small rise in crop receipts was the 14.1% increase in corn receipts, mainly attributable to an 11.1% rise in marketings.
The 6.5% drop in canola receipts in 2018 was the first decrease since 2013. Lower exports pushed marketings down 6.4%. Producers in Alberta were the hardest hit as canola receipts fell 16.1% in the province. Rail disruptions early in the year, a late harvest and lower production contributed to lower marketings.
Lentil receipts fell 35.1% in 2018 following a 46.0% drop in 2017. Prices were down 36.6%. Duties on imports of lentils, imposed by the Indian government in late 2017, restricted exports and lowered prices for Canadian producers.
Livestock receipts down slightly as hog receipts fall
Revenue from livestock production edged down 0.1% to $25.1 billion in 2018.
Lower prices resulting from record high North American inventories pushed hog receipts down 8.9%. Exacerbating the surplus of hogs in the United States were retaliatory pork tariffs imposed on the United States by China and Mexico.
A 2.9% rise in the receipts of supply-managed commodities moderated the decline in livestock revenue. Chicken receipts posted the largest increase (+5.9%) as marketings were up 4.8%.
There was little change in cattle and calf revenue (+0.3%), as small price decreases were offset by higher marketings.
Program payments decrease in 2018
Program payments to producers declined 8.9% from a year earlier to $2.2 billion in 2018. This followed a marginal decrease of 0.3% in 2017. Lower crop insurance payments in Saskatchewan and Alberta more than offset higher provincial stabilization payments in Quebec.
Largest hike in farm expenses in six years
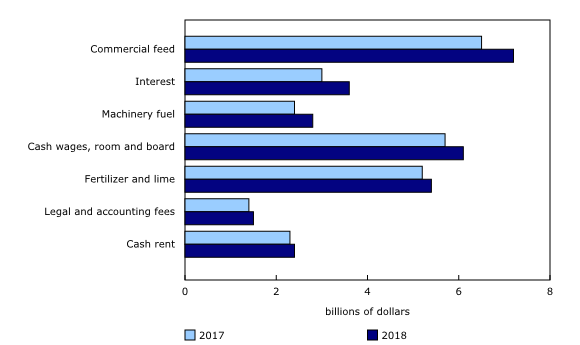
Farm operating expenses (after rebates) rose 6.2% in 2018 to $50.5 billion—the largest increase since 2012.
Higher feed prices contributed to a 9.4% rise in feed expenses, as tight feed grain supplies prior to the 2018 harvest supported prices.
The 19.6% hike in interest expenses was the largest percentage increase since 1981. Higher rates and higher debt levels contributed to the rise.
Machinery fuel expenses increased 18.0% in 2018, following a 9.4% rise in 2017. In both cases, price increases were the main contributing factor.
Cash wages were up 7.3% in 2018—the largest percentage increase since 1994. A 12.7% hike in Ontario accounted for much of the increase as minimum wage legislation pushed wages higher in the horticulture sector. Increased cannabis production also contributed to higher labour costs in Ontario and in other provinces.
Total farm expenses, which include depreciation costs, rose 5.7% to $58.3 billion as depreciation charges increased 2.2%.
Total farm expenses were up in every province. The smallest percentage increase (+3.6%) was in Saskatchewan, while the largest rise was in New Brunswick (+14.1%).
Steep drop in total net income
Total net farm income fell by $4.7 billion to $3.6 billion in 2018—largely due to the $2.9 billion drop in realized net income.
Total net farm income is realized net income adjusted for changes in the farmer-owned inventories of crops and livestock. It represents the return to owner's equity, unpaid farm labour, management and risk.
Also contributing to the drop in total net income were lower on-farm inventories of barley, corn and cattle and calves, which pushed down the value of inventory change from a positive value in 2017 (+$1.2 billion) to a negative value in 2018 (-$559 million).
Total net farm income decreased in every province.
Note to readers
Realized net income can vary widely from farm to farm because of several factors, including the farm's type of commodities, prices, weather and economies of scale. This and other aggregate measures of farm income are calculated on a provincial basis employing the same concepts used in measuring the performance of the overall Canadian economy. They are a measure of farm business income, not farm household income.
Additional financial data for 2018, collected at the individual farm business level using surveys and other administrative sources, will be made available later this year. These data will help explain differences in the performance of various types and sizes of farms.
Preliminary farm income data for the previous calendar year are first released in May of each year, five months after the reference period. Revised data are then released in November of each year, incorporating data received too late to be included in the first release. Data for two years prior to the reference period are also subject to this revision.
For details on farm cash receipts for the first three quarters of 2019, see the "Farm cash receipts" release in today's Daily.
Products
The interactive Net farm income by province data visualization tool is available on the Statistics Canada website.
Contact information
For more information, or to enquire about the concepts, methods or data quality of this release, contact us (toll-free 1-800-263-1136; 514-283-8300; STATCAN.infostats-infostats.STATCAN@canada.ca) or Media Relations (613-951-4636; STATCAN.mediahotline-ligneinfomedias.STATCAN@canada.ca).
- Date modified:


