Canadian Health Measures Survey: Environmental laboratory data, 2016 and 2017
Archived Content
Information identified as archived is provided for reference, research or recordkeeping purposes. It is not subject to the Government of Canada Web Standards and has not been altered or updated since it was archived. Please "contact us" to request a format other than those available.
Released: 2019-11-13
Bisphenol A (BPA) and perfluoroalkyl substances (PFAS) are both used in industrial processing to create various products that Canadians use regularly. BPA is used in the production of some food and drink containers, food packaging, thermal printing paper, as well as consumer products such as some toys or medical devices. PFAS are used in the production of some textiles, carpets, hoses, cables, cookware and personal care products.
BPA and PFAS continue to be studied to determine their effects on human health. Key areas of interest include BPA's possible links to obesity and other metabolic disorders, while PFAS may be linked to thyroid effects in children and youth.
It is important to monitor these and other environmental chemicals to determine if government, industrial or individual actions are having an impact to reduce these chemicals in our environment. Monitoring chemicals in biological fluids or tissues is known as biomonitoring.
Almost all Canadians have BPA or PFAS in their body
BPA and PFAS were measured in Canadians aged 3 to 79 in the most recent cycle of the Canadian Health Measures Survey (CHMS). More than four-fifths (81.5%) of Canadians had BPA detected in their urine, while 98.5% of Canadians had the following three PFAS in their blood: perfluorooctane sulfonate (PFOS), perfluorooctanoic acid (PFOA) and perfluorohexane sulfonate (PFHxS).
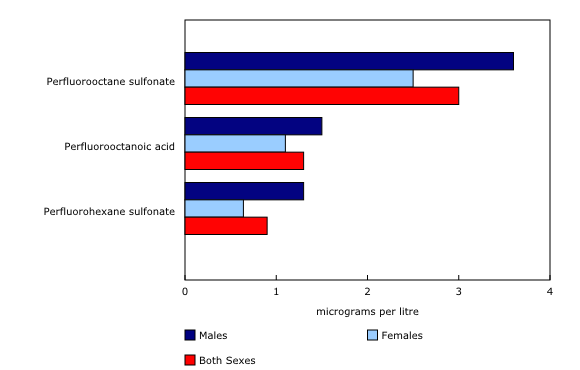
The average concentration of BPA among Canadians was 0.81 micrograms per litre (μg/L), while the average concentrations of these PFAS were 3.0 μg/L for PFOS, 1.3 μg/L for PFOA and 0.90 μg/L for PFHxS.
Concentrations of BPA and PFAS in Canadians have decreased over time
Concentrations of BPA and PFAS have decreased significantly in the Canadian population. The average concentration of BPA was one-third less in Cycle 5 of the CHMS (2016 and 2017) than in Cycle 1 (2007 to 2009). Similarly, concentrations of PFAS in Cycle 5 (2016 and 2017) were approximately half of those in Cycle 1 (2007 to 2009).
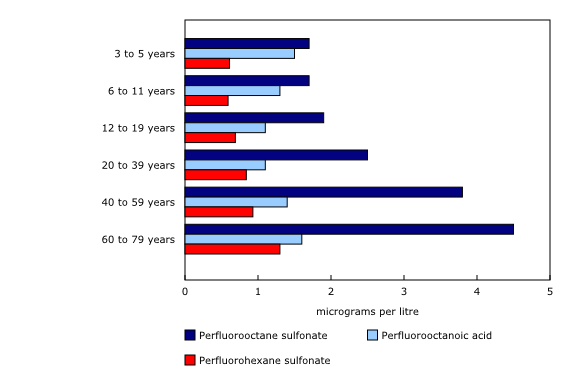
Children and youth aged 3 to 19 had higher concentrations of BPA in their urine (0.96 μg/L) than adults (0.78 μg/L). BPA concentrations in males (0.84 μg/L) and females (0.78 μg/L) were not significantly different. Comparatively, concentrations of PFOS and PFHxS measured in Canadians increased with age, and higher concentrations were observed in males than in females for all three PFAS.
The 2016 and 2017 data release is the fifth cycle of human biomonitoring data produced by the CHMS. Multiple cycles of biomonitoring data provide Canadians with important information on environmental chemicals at a given point in time and enable governments to monitor trends in the Canadian population.
Note to readers
The Canadian Health Measures Survey (CHMS) measured bisphenol A in urine and perfluorooctane sulfonate, perfluorooctanoic acid and perfluorohexane sulfonate in blood of a representative sample of Canadians aged 3 to 79 years in Cycle 5.
Concentrations are presented as a geometric mean, which is a type of average that is less influenced by extreme values than the traditional arithmetic mean. The geometric mean provides a better estimate of the Canadian population when the data are highly skewed. This type of calculation is common in the measurement of environmental chemicals in urine and blood.
The presence of a chemical in a person's body does not necessarily mean that it will affect their health. Factors such as the amount to which a person is exposed, the duration and timing of exposure, and the toxicity of the chemical are important to consider when determining whether adverse health effects may occur.
Children aged 3 to 5 were not participants in Cycle 1 (2007 to 2009) of the CHMS. Concentrations of the presented perfluoroalkyl substances were not measured in 6 to 19 year olds in Cycle 1 (2007 to 2009) and 3 to 11 year olds in Cycle 2 (2009 to 2011).
The CHMS Cycle 5 was conducted from January 2016 to December 2017.
Additional information on these and many other environmental chemicals is presented in Health Canada's Fifth Report on Human Biomonitoring of Environmental Chemicals in Canada.
Products
The infographic "Lead and bisphenol A (BPA) concentrations in the Canadian population," which is part of the series Statistics Canada — Infographics (11-627-M), is now available.
Contact information
For more information, or to enquire about the concepts, methods or data quality of this release, contact us (toll-free 1-800-263-1136; 514-283-8300; STATCAN.infostats-infostats.STATCAN@canada.ca) or Media Relations (613-951-4636; STATCAN.mediahotline-ligneinfomedias.STATCAN@canada.ca).
- Date modified:


