Oil and gas extraction, 2018
Archived Content
Information identified as archived is provided for reference, research or recordkeeping purposes. It is not subject to the Government of Canada Web Standards and has not been altered or updated since it was archived. Please "contact us" to request a format other than those available.
Released: 2019-09-18
Total revenue for the Canadian oil and gas extraction industry rose 4.9% to $123.5 billion in 2018, following a 35.5% increase in 2017.
In 2018, total expenses in the oil and gas extraction industry were $137.4 billion (up 25.6%), resulting in a net loss of $13.9 billion.
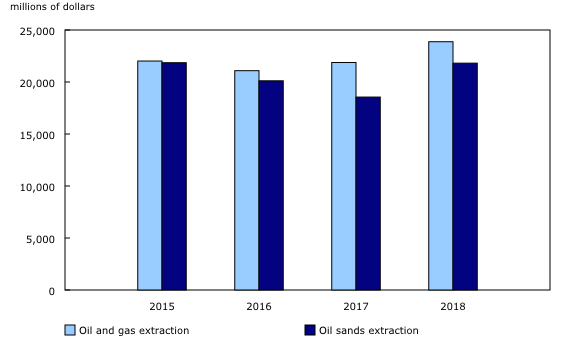
Total operating expenses increased 13.0% to $45.7 billion in 2018, following a 1.9% decline in 2017. Operating expenses in the oil sands sector (formerly non-conventional oil extraction) were up 17.6% to $21.8 billion, while operating expenses in the oil and gas extraction sector (formerly conventional oil extraction) increased 9.1% to $23.9 billion.
Royalty payments totalled $7.6 billion in 2018, up 14.4% from $6.6 billion in 2017.
Capital expenditures down
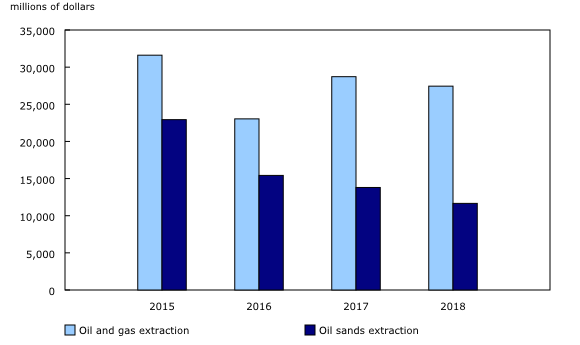
Overall, capital expenditures in the oil and gas extraction industry decreased 8.0% to $39.1 billion in 2018. The decline was attributable to a 15.5% decrease in spending by the oil sands sector to $11.7 billion. This decrease was due in part to the completion of two major oil sands projects, Fort Hills and Horizon, which came on line at the start of 2018.
Meanwhile, capital spending by the oil and gas extraction sector (conventional) fell 4.4% compared with the previous year.
Volume and value of production rises
Production volumes for crude oil, equivalent products and natural gas increased in 2018. Over the same period, the overall value of these products rose 9.4% to $116.7 billion.
Production of crude oil and equivalent products was up 8.7% to 251.8 million cubic metres in 2018, and the market value of these products rose 13.4% to $94.5 billion.
Higher industrial prices for crude oil were a contributing factor to the increase in value. According to the Raw Materials Price Index, the average annual price of crude oil and crude bitumen increased 20.5% year over year, following a 19.4% increase in 2017.
Marketable production of natural gas increased 3.9% to 172.7 billion cubic metres, while the value of natural gas decreased 30.1% to $8.8 billion in 2018.
Over the same period, production of natural gas by-products rose 10.1% to 52.5 million cubic metres, while the value of these products increased 24.8% to $13.5 billion.
Total assets decrease
Total assets, including cash, accounts receivable, inventories, buildings and machinery, reported by oil and gas companies operating in Canada were down 3.1% in 2018 to $556.1 billion.
Over the same period, total liabilities, which include such items as current portion of long-term debt, accounts payable and notes payable, increased 2.0%.
Equity, including common shares and retained earnings, decreased 9.4%.
Note to readers
The Annual Oil and Gas Extraction Survey program disseminates its data in tables 25-10-0064-01 (oil and gas extraction capital expenditures and operating costs) and 25-10-0065-01 (oil and gas extraction revenues, expenses and balance sheet) starting with the 2015 reference year.
The oil and gas extraction industry includes establishments engaged primarily in operating oil and gas field properties. This includes the production and extraction of oil from oil shale and oil sands.
Oil and gas extraction (formerly known as conventional oil and gas extraction) includes establishments engaged primarily in the production of petroleum or natural gas from wells in which the hydrocarbons will initially flow or can be produced using normal pumping techniques.
Oil sands extraction (formerly known as non-conventional oil and gas extraction) includes establishments engaged primarily in producing crude oil from surface shales, oil sands, or reservoirs in which the hydrocarbons are semisolids and conventional production methods are not possible.
Crude oil and equivalent products include crude oil, crude bitumen, synthetic crude oil and condensate.
Natural gas by-products include ethane, propane, butane and pentanes plus. Elemental sulphur is not included.
Other assets include all assets not reported as either current or capital assets.
Other liabilities include all liabilities not reported as either a current liability or long-term debt.
Equity includes common shares, preferred shares, retained earnings and all other equity.
Raw Materials Price Index
Data for the Raw Materials Price Index were taken from table 18-10-0034-01.
Data for 2017 have been revised.
Contact information
For more information, or to enquire about the concepts, methods or data quality of this release, contact us (toll-free 1-800-263-1136; 514-283-8300; STATCAN.infostats-infostats.STATCAN@canada.ca) or Media Relations (613-951-4636; STATCAN.mediahotline-ligneinfomedias.STATCAN@canada.ca).
- Date modified:


