Visitor Travel Survey, first quarter 2019
Archived Content
Information identified as archived is provided for reference, research or recordkeeping purposes. It is not subject to the Government of Canada Web Standards and has not been altered or updated since it was archived. Please "contact us" to request a format other than those available.
Released: 2019-08-27
Travellers from abroad made 4.8 million trips to Canada in the first quarter, down 0.6% from the first quarter of 2018. Foreign traveller spending totalled $3.0 billion in Canada, more than half (54.4%) of which was by residents from overseas countries (countries other than the United States).
Winter weather slows down visits from the United States
US travellers took 3.8 million trips to Canada in the first quarter, down 1.4% year over year. This decline coincided with severe snowstorms in the second half of January 2019 that covered much of the Pacific Northwest, as well as extreme cold conditions that lingered for several weeks into February in Western and Central Canada. These two months were among the snowiest and coldest on record in these regions.
US residents made fewer trips to Canada for pleasure or leisure (-4.7%, to 1.2 million) and for business-related purposes (-3.5%, to 902,000) in the first quarter. Travel to Canada for these purposes accounted for over half of all trips to Canada by US residents during the quarter. Trips from the United States to visit friends or relatives in Canada constituted the lone increase (+11.8%, to 780,000) year over year in the first quarter.
Similar to previous quarters, Ontario (43.9%) and British Columbia (30.9%) were the provinces most visited by US residents for pleasure or leisure, followed by Quebec (16.2%), Alberta (3.2%) and New Brunswick (3.1%).
US residents spent an estimated $1.4 billion in the first quarter, with an average travel expenditure of about $370 per trip to Canada. Accommodation (39.5%) and food and beverages (30.2%) were the largest expense items, followed by costs of transportation within Canada (12.9%) and recreation and entertainment (10.5%).
Arrivals from overseas increase
Travellers from overseas countries made 1.0 million trips to Canada in the first quarter, up 2.6% year over year.
With 446,000 trips to Canada, Asia and Oceania was the leading region for overseas travellers in the first quarter, followed by Europe (385,000 trips).
The top three source countries for overseas travellers to Canada during the first quarter were China (137,000 trips), the United Kingdom (101,000 trips) and France (93,000 trips). Mexico (82,000 trips), Australia (55,000 trips), India (45,000 trips), Japan (44,000 trips) and Germany (41,000 trips) rounded out the next five top source countries.
British Columbia was the province most-visited by travellers from Asia and Oceania. About 6 out of every 10 travellers from overseas to British Columbia came from Asia and Oceania. Quebec and Nova Scotia were the only provinces that received more visitors from Europe than from Asia and Oceania.
Travellers from overseas countries came to Canada in the first quarter primarily to visit their friends or relatives (394,000 trips), accounting for 38.1% of all trips to Canada from overseas. Pleasure or leisure (277,000 trips) was the next most common reason for visiting Canada, followed by travel for other personal reasons (187,000 trips) and travel for business-related purposes (176,000 trips).
Travellers from Europe and the Asia and Oceania region came to Canada primarily to visit friends or relatives and for leisure or pleasure; approximately two-thirds of trips from Europe (63.3%) and Asia and Oceania (68.1%) were for these purposes.
Travellers from Central, South and North America (excluding the United States) travelled to Canada primarily for leisure or pleasure, while residents of the Caribbean and Africa travelled to Canada mainly to visit friends or relatives.
Overseas travellers spent an estimated $1.6 billion to Canada in travel spending in the first quarter. On average, residents of overseas countries spent about $1,600 per trip in Canada, or about four times the average spending per trip by US travellers. This was mainly because overseas travellers stayed longer than US visitors. On average, overseas travellers to Canada stayed 22 nights per trip, compared with an average of 4 nights by travellers from the United States.
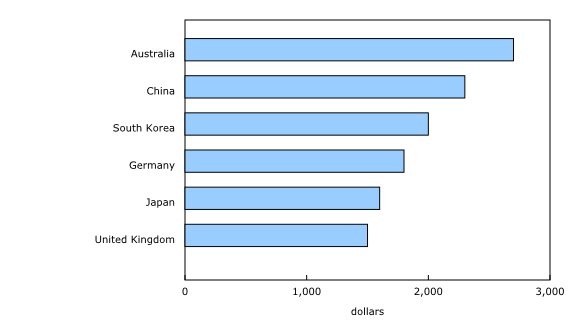
In terms of the amount of average spending by travellers, visitors from Australia and China spent the most per trip in Canada during the first quarter. Visitors from Australia spent $2,700 per trip in Canada, while visitors from China spent $2,300. Travellers from Australia, however, stayed 19 nights per trip compared with 36 nights by visitors from China.
Visitors from Australia spent 42.7% of their total expenditures on accommodation, whereas visitors from China spent 18.4% on this category. This difference in spending pattern is likely because travellers from China came to Canada primarily to visit friends or relatives or for other personal reasons. In contrast, visitors from Australia primarily visited Canada for pleasure or leisure holidays.
Accommodation (34.2%) and food and beverages (25.6%) accounted for more than half of all travel spending in Canada by overseas residents. Other significant expense items were clothes and gifts (19.3%), recreation and entertainment (9.8%) and transportation within Canada (9.5%) (excluding the costs of travel to Canada from overseas).
Vancouver, Coast and Mountains: The top-earning tourism region
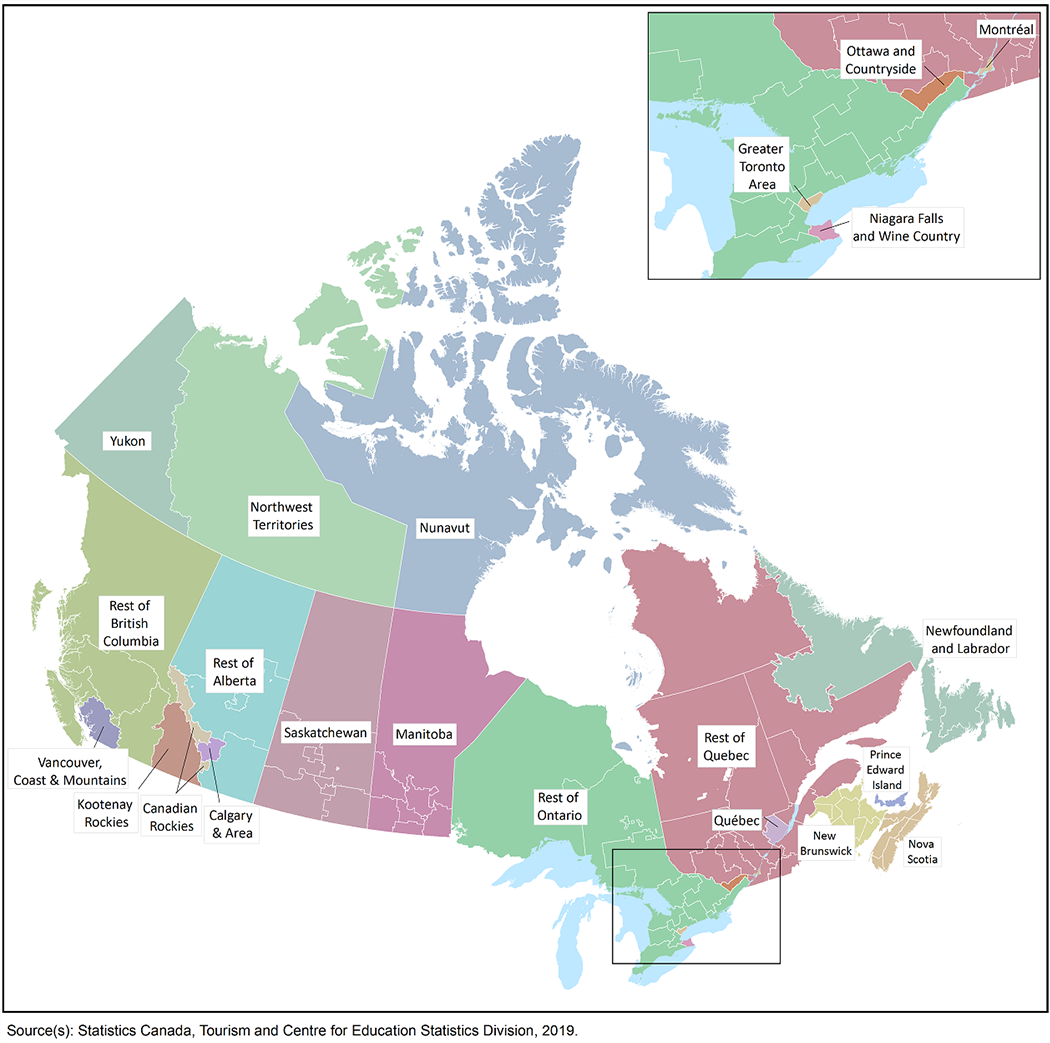
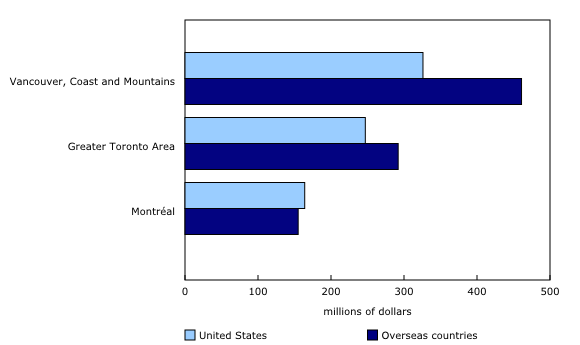
Foreign traveller spending amounted to $787 million in the Vancouver, Coast and Mountains region, the top-earning tourism region during the first quarter. This region took in 26.1% of the total foreign traveller spending in Canada.
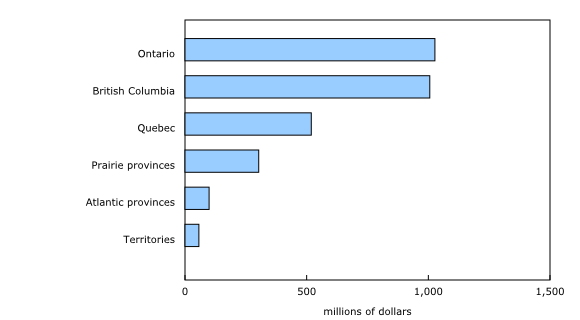
US travellers, at $326 million, accounted for 41.4% of total foreign travel spending in the Vancouver, Coast and Mountains region, followed by visitors from China ($142 million), Australia ($69.7 million) and the United Kingdom ($40.2 million). At the provincial level, however, British Columbia ($1.01 billion) followed Ontario ($1.03 billion) in terms of the amount of total spending by travellers.
The Greater Toronto Area ($540 million) was the highest earning region in Ontario and the second highest nationally. Visitors from the United States accounted for the largest share of foreign travel spending in the Greater Toronto Area during the first quarter. They contributed 45.8% of the total foreign travel expenditures in the region, representing an estimated $247 million during the quarter. Visitors from China ($60.4 million) and the United Kingdom ($21.2 million) were the largest spenders from overseas in the region, followed by visitors from Germany ($13.0 million), India ($12.5 million) and Australia ($11.9 million).
Montréal, at $319 million, ranked third in terms of travel spending by tourism region and was the highest earning region in Quebec (61.5% of the provincial total). US visitors accounted for more than half ($164 million) of all travel earnings from foreign travel in the region, followed by visitors from France ($37.7 million), China ($16.9 million) and the United Kingdom ($10.9 million).
Foreign visitors spent $303 million (10.1% of the national total) in the Prairie provinces. The Canadian Rockies tourism region, located in Alberta, comprised 28.9% of all foreign travel spending in the Prairies, with overseas visitors contributing just under two-thirds of all travel expenditures in the region (or an estimated $56.3 million).
Atlantic Canada received $99.0 million in foreign travel spending. Nova Scotia was the highest earning region ($35.0 million), followed by New Brunswick ($27.3 million).
Tourism regions in the territories received $57.3 million in foreign travel spending. The largest spenders in the territories were US visitors ($12.7 million) when compared with amounts spent by visitors from countries other than the United States.
Note to readers
This is the first release of 2019 quarterly data from the Visitor Travel Survey (VTS). The VTS collects information about international travel to Canada by US and overseas residents.
The VTS was developed to fully replace the inbound visitor component of the International Travel Survey (ITS), and consists of two components: the electronic questionnaires and the Air Exit Survey. Data from the VTS are historically comparable with data from the ITS.
The VTS uses Statistics Canada's Frontier Counts as benchmarks for the numbers of travellers to Canada. Statistics Canada's Frontier Counts are produced using administrative data from the Canada Border Services Agency (CBSA) on all international travellers who have been cleared for entry or re-entry into Canada. Note that counts of international travellers in the 2017 releases are based on updated Frontier Counts totals, while totals from the 2017 ITS have yet to be revised.
Starting with the release of 2018 third quarter data, VTS data include sub-provincial estimates of tourism spending by international visitors to Canada. These estimates are produced using Small Area Estimation (SAE) modelling to combine data collected from the VTS with aggregated payment processor data acquired by Destination Canada and provided to Statistics Canada. The payment processor's data include information on spending category, tourism region and country of credit cards origin used by international visitors to Canada. They contain no information identifying an individual or a specific transaction. Methodological information is available online.
The sum of spending data derived from the SAE model will not equal that produced by the VTS alone. When analyzing spending data, users are advised to use the estimates derived from the SAE model.
Overseas countries refer to countries other than the United States.
A trip to Canada is made by a resident of a country other than Canada who is cleared through a CBSA point of entry on a visit for a period of less than 12 months. A Canadian citizen residing outside Canada for more than 12 months who comes to Canada is included as a traveller from a country other than Canada.
A trip to Canada for a person residing in a country other than Canada starts when they are cleared through a CBSA point of entry to enter Canada and ends when they exit Canada.
Trips and visits: A trip can consist of one or more visits. A traveller from a country other than Canada may stay in several locations during a trip to Canada. Each stay at a Canadian location (for example, a province) within a given trip represents a visit.
Products
Data from the Visitor Travel Survey for the first quarter of 2019 are now available. Data tables, including statistical profiles of international travellers visiting Canada, are available upon request.
Contact information
For more information, or to enquire about the concepts, methods or data quality of this release, contact us (toll-free 1-800-263-1136; 514-283-8300; STATCAN.infostats-infostats.STATCAN@canada.ca) or Media Relations (613-951-4636; STATCAN.mediahotline-ligneinfomedias.STATCAN@canada.ca).
- Date modified:


