Impact of recent tariffs on Canada's merchandise trade
Archived Content
Information identified as archived is provided for reference, research or recordkeeping purposes. It is not subject to the Government of Canada Web Standards and has not been altered or updated since it was archived. Please "contact us" to request a format other than those available.
Released: 2019-08-02
On March 1, 2018, the United States announced its intent to impose import tariffs of 25% on Canadian steel products and 10% on Canadian aluminum products; these tariffs came into force on June 1. In response, on May 31, Canada announced its intent to impose retaliatory tariffs of 25% on imports of US steel products and 10% on imports of US aluminum products and various other products; these tariffs were implemented on July 1. Both governments lifted their respective tariffs on May 20, 2019. The impact of these tariffs on Canada's exports and imports was noteworthy and varied by product group.
US tariffs reverse upward trend in Canada's exports of steel to the United States
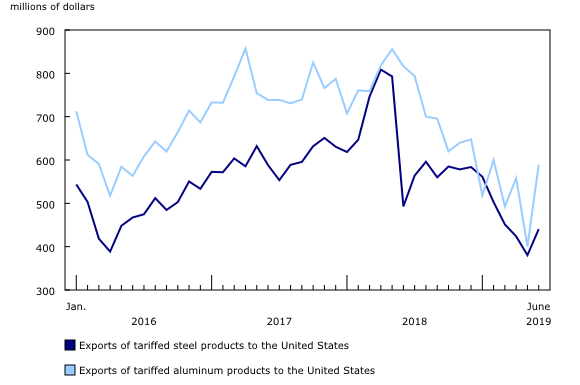
Canada's exports of steel products to the United States showed a strong upward trend in the two years prior to the introduction of the 25% tariff on US imports of Canadian steel. Higher volumes and prices for basic and semi-finished iron and steel products were also observed in those two years.
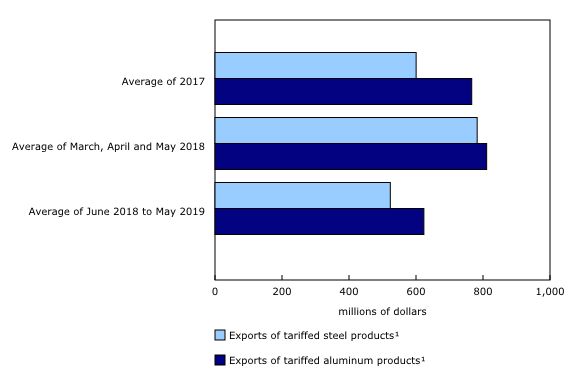
Following the announcement of these tariffs, Canada's exports of steel to the United States advanced notably, up 22.6% from February 2018 (the last month before the announcement) to May 2018 (the last month before implementation). In addition, from March to May 2018, the average monthly value of these exports was 30.3% higher than the monthly average observed in 2017, the year prior to the implementation of these supplementary tariffs.
Exports of steel products to the United States decreased significantly immediately following the implementation of US tariffs, declining 37.8% in June 2018, before rebounding partially in July (+14.5%). While monthly export movements varied for the remainder of the tariff period, the net effect was a decline, as the value of exports in May 2019 was at its lowest level in almost 10 years.
In June 2019, the first month after tariffs were lifted, exports of steel products to the United States grew by 15.8%. This coincided with a 20.3% increase in export volumes of basic and semi-finished iron and steel products, the largest monthly increase in 10 years.
Canada's exports of aluminum drop after implementation of US tariffs
As with steel products, exports of aluminum products to the United States also experienced significant growth in the two years prior to the introduction of tariffs. This increase coincided with a rise in prices of unwrought aluminum and aluminum alloys. Export volumes for aluminum products also rose during this time.
Following the announcement that 10% tariffs would be applied to US imports of aluminum from Canada, Canada's exports to the United States rose significantly, up 12.5% from February 2018, the month before the announcement, to May 2018.
Following the implementation of these tariffs in June 2018, Canada's exports of aluminum products to the United States decreased more gradually than exports of steel products. Additionally, exports of aluminum products fell in each of the first five months following the introduction of tariffs before recovering slightly in November 2018. The average monthly export value during the tariff period was 18.6% lower than the average in 2017.
Overall, Canada's exports of aluminum products to the United States fell by more than half after US tariffs were implemented, reaching their lowest level in more than 10 years in May 2019. At the same time, prices and volumes of unwrought aluminum and aluminum alloys also experienced significant decreases.
In June 2019, the first month after tariffs were lifted, exports of aluminum products to the United States were up 47.2%. Meanwhile, export volumes of unwrought aluminum and aluminum alloys rose 35.3%, the largest increase in over 10 years.
Canada's imports of US steel products rise sharply in June 2018 and decline steeply in July 2018
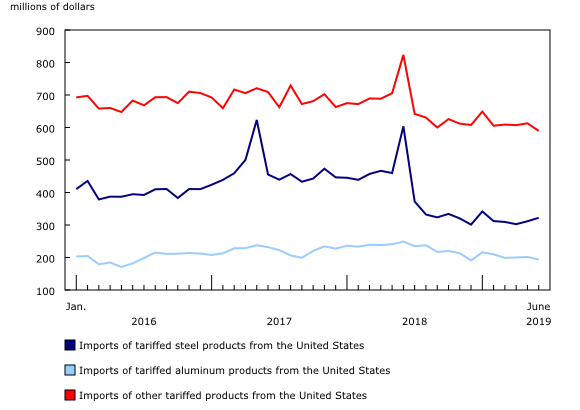
Canada responded to the US tariffs on steel and aluminum products with the announcement in May 2018 of retaliatory tariffs on imports of US steel and aluminum products as well as various other products from the United States. Following this announcement, Canada's imports of steel products from the United States rose 31.3%, bringing the value of these imports in June 2018 to the second highest level on record.
After Canada began collecting retaliatory tariffs, imports of US steel products fell sharply in July (-38.3%) and August 2018 (-10.8%). Fewer fluctuations in imports of US steel products were evident after this period, although they decreased a further 6.2% from August 2018 to May 2019.
Overall, the monthly average value of imported US steel products from July 2018 to May 2019 was 30.5% lower than the 2017 monthly average. However, average monthly prices of basic and semi-finished iron and steel products increased during this period, up 22.0% from 2017.
Imports from the United States recovered modestly (+3.4%) in June 2019 after the tariffs were lifted.
Moderate decrease in Canada's imports of US aluminum products after tariffs are implemented
While Canada's imports of steel products were notably affected by these retaliatory tariffs, the impact on imports of aluminum products was more moderate. In the month following the announcement of 10% tariffs (June 2018), Canada's imports of aluminum products from the United States were up 3.6%.
With the implementation of these tariffs, imports of aluminum products declined 5.8% in July 2018, followed by a steady, moderate decrease of 14.1% in comparison to May 2019. Despite these declines, the average monthly value of imports from July 2018 to May 2019 was 3.9% below the monthly average in 2017, when these supplementary tariffs were not a factor.
Despite the elimination of tariffs in late May, there was a 3.9% decline in imports of aluminum products from the United States in June 2019.
Marked increase in Canada's imports of other tariffed products from the United States followed by steep decline after tariff implementation
In addition to steel and aluminum products, Canada implemented tariffs on imports of a variety of other products from the United States. Similar to the trend seen in imports of steel and aluminum products over this period, imports of these other products rose after the tariffs were announced and fell once the tariffs were implemented. In fact, these imports rose 16.8% in June 2018, followed by a 22.0% decline in July, the first month they were subject to retaliatory tariffs. In May 2019, imports declined a further 2.8% in comparison to August 2018.
Following the implementation of the tariffs, the monthly average import value was 10.8% lower than the monthly average for 2017, with the value of imports reaching a low in September 2018.
Similar to aluminum products, imports of these other products did not immediately recover in June 2019, falling 3.8% in the first month after the tariffs expired.
Values of exports and imports of tariffed products at roughly the same levels since the beginning of 2018
The steel and aluminum products that the US government identified for tariffs represented about $16.6 billion of Canadian exports in 2017. In retaliation, the Canadian government decided to target an equal value of imports from the United States. Even though the implementation of these tariffs resulted in high volatility in monthly trade values, since January 2018, values of both Canada's exports and imports of tariffed products have been roughly the same ($22 billion).
Value of collected duties in Canada and the United States increases
The implementation of tariffs was evident in the increase in the value of duties collected by both the Canadian and the US governments during this period. Duties collected on Canada's imports of steel, aluminum and other tariffed products from the United States rose significantly, from a monthly average of $46.9 million in 2017 to $189.7 million after the retaliatory tariffs were applied. The ratio of duties collected to the value of Canada's total imports from the United States rose from 0.2% in June 2018 to 0.7% in July 2018.
For Canada's exports, the duties collected by the US government on Canadian steel and aluminum products rose by a greater amount than the duties Canada collected on these goods. In 2017, the United States collected an average of $24.2 million in duties per month, rising to an average of $205.0 million per month in the period following the implementation of US tariffs. The ratio of duties collected to total US imports of Canadian products rose from 0.1% in May 2018 to 0.6% in June 2018.
Note to readers
The aggregate values discussed in this release correspond to the Harmonized System (HS) codes that were subject to tariffs and include trade with the United States only. Two US aluminum codes specified in the Presidential Proclamation Adjusting Imports of Aluminum into the United States (aluminum castings and forgings included in the Harmonized Tariff Schedule of the United States codes 7616.99.51.60 and 7616.99.51.70) are excluded from the Canadian aluminum export values. In the Canadian export classification, these products are combined with other products that are not in scope for US tariffs.
The price data are aggregated at the North American Product Classification System group level and include trade with all countries and not just the United States. The steel and aluminum HS codes subject to tariffs are contained in these groups (311, 312, 321 and 327), along with other HS codes that were not subject to tariffs.
Data definitions and data quality
The Canadian international merchandise trade data presented in this report are on a customs basis and are seasonally adjusted. Prices are based on aggregate Paasche (current-weighted) price indexes (2012=100). Volumes, or constant dollars, are calculated using the Laspeyres formula (2012=100).
"Duties" represent the values collected based on the tariff rates applied to imports classified under the Harmonized System as outlined in the Customs Tariff, as well as the values collected based on the goods subject to countervailing duties, antidumping duties or other subsidies under the Special Import Measures Act. The values of duties were reported by the importer on the Canada Customs Coding Form when goods were presented to the Canada Border Services Agency (CBSA) for import into Canada. More information can be found on the CBSA's website.
The values of duties included in this report do not necessarily represent the amounts of duty paid.
The ratio of duties to imports is calculated by dividing the value of imports by the value of duties; it is expressed as a percentage.
United States Census Bureau data
The United States Census Bureau's international trade statistics, as published on July 3, 2019, were converted from US dollars to Canadian dollars using the Bank of Canada's monthly average of the daily end-of-day exchange rate.
The United States Census Bureau provides the following note with regard to the "calculated duty" data: "Estimates of calculated duty do not necessarily reflect amounts of duty paid and should, therefore, be used with caution. The inclusion in the figures of some US products returned after processing and assembly abroad, for which a portion of the value is eligible for duty free consideration, may cause these duty figures to be somewhat overstated as a result. In cases where articles are dutiable at various or special rates, a dutiable value is shown but no duty is calculated. Thus, there is an understatement in the estimates of calculated duty to the extent that these situations exist."
Products
For more information on Canada's import duties and tariffs, please see Canada's import duties, 1988 to 2018. For data on Canada's import and duty values, please see Canada's import and duty values from the world and from the United States. For data on the impact of tariffs on Canadian industries, please see Facts on select Canadian industries impacted by tariffs.
Contact information
For more information, contact us (toll-free 1-800-263-1136; 514-283-8300; STATCAN.infostats-infostats.STATCAN@canada.ca) or Media Relations (613-951-4636; STATCAN.mediahotline-ligneinfomedias.STATCAN@canada.ca).
To enquire about the concepts, methods or data quality of this release, contact Nita Boushey (613-404-4965; nita.boushey@canada.ca), International Accounts and Trade Division.
- Date modified:


