Consumer Price Index, June 2019
Archived Content
Information identified as archived is provided for reference, research or recordkeeping purposes. It is not subject to the Government of Canada Web Standards and has not been altered or updated since it was archived. Please "contact us" to request a format other than those available.
Released: 2019-07-17
June 2019
2.0% 
(12-month change)
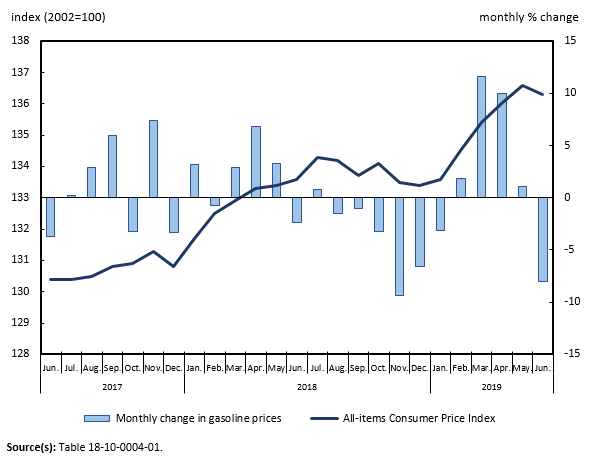
The Consumer Price Index (CPI) rose 2.0% on a year-over-year basis in June, down from a 2.4% increase in May, largely due to lower month-over-month energy prices. Excluding energy, the CPI rose 2.6% year over year. Prices increased year over year in all eight major components.
On a seasonally adjusted monthly basis, the CPI declined 0.1% in June, following a 0.3% gain in May.
Consumer Price Index data visualization tool
The Consumer Price Index (CPI) data visualization tool provides access to current and historical data in a dynamic and customizable format. Check out the latest CPI snapshot to find out what's currently driving price changes in the CPI. Explore key CPI indicators and compare price changes of all the goods and services in the CPI basket over time and by geography.
This web-based application is updated every month with the release of the CPI.
Visit our interactive Consumer Price Index Data Visualization Tool and stay tuned for a new CPI Portal coming soon!
Highlights
Energy
Energy prices fell 4.1% year over year in June, following a 0.1% decrease in May. Consumers paid less for gasoline (-9.2%) and fuel oil and other fuels (-4.1%). This was due in part to falling oil prices amid rising fuel inventories in the United States and the elimination of carbon pricing in Alberta at the end of May.
Durable goods
The purchase of passenger vehicles index rose 3.0% on a year-over-year basis in June, following a 4.2% increase in May.
Food
The year-over-year increase in the food index (+3.5%) was led by higher prices for fresh vegetables (+17.3%) in June. This increase, the largest since January 2016, was attributable in part to inclement weather in agricultural regions.
Insurance
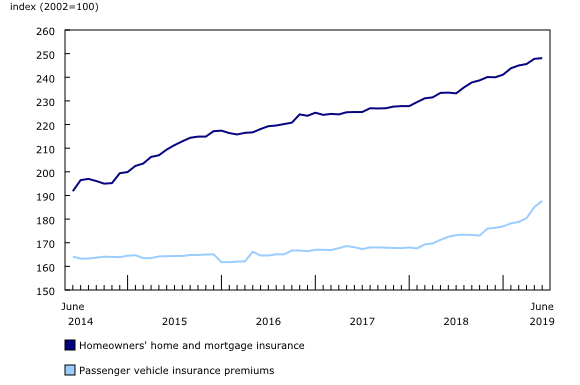
Following a series of rate increases, consumers paid more year over year for homeowners' home and mortgage insurance (+6.3%) and passenger vehicle insurance premiums (+8.8%) in June. These increases were attributable, in part, to the rising cost and frequency of claims associated with weather-related events.
Regional highlights
Among the provinces, energy prices fell the most year over year in Alberta (-8.4%) in June. Gasoline prices decreased 17.9% in the province, following a decline in global oil prices and the removal of carbon pricing. Natural gas prices fell 3.5% in Alberta due in part to a supply glut related to pipeline maintenance.
Note to readers
Changes to the table "Inter-city indexes of price differentials of consumer goods and services": Addition of a new geographic stratum
With this release, data on inter-city indexes of price differentials of consumer goods and services, appearing in table 18-10-0003-01, have been updated to October 2018. In addition, the geographic stratum "Iqaluit, Nunavut" was introduced into the table, reflecting data for the food major component.
User consultations
Statistics Canada is planning a series of user consultations on the Consumer Price Index (CPI) program. If you are a user of the CPI and wish to participate, please send an email to: statcan.cpddisseminationunit-dpcunitedediffusion.statcan@canada.ca with your name, organization and contact information.
Real-time data tables
Real-time data table 18-10-0259-01 will be updated on July 29.
Next release
The Consumer Price Index for July will be released on August 21.
Products
The interactive Consumer Price Index Data Visualization Tool is available on the Statistics Canada website.
More information about the concepts and use of the Consumer Price Index (CPI) is available in The Canadian Consumer Price Index Reference Paper (62-553-X).
For information on the history of the CPI in Canada, consult the publication Exploring the First Century of Canada's Consumer Price Index (62-604-X).
Two videos, "An Overview of Canada's Consumer Price Index (CPI)" and "The Consumer Price Index and Your Experience of Price Change," are available on Statistics Canada's YouTube channel.
Contact information
For more information, or to enquire about the concepts, methods or data quality of this release, contact us (toll-free 1-800-263-1136; 514-283-8300; STATCAN.infostats-infostats.STATCAN@canada.ca) or Media Relations (613-951-4636; STATCAN.mediahotline-ligneinfomedias.STATCAN@canada.ca).
- Date modified:


