Consumer Price Index, March 2019
Archived Content
Information identified as archived is provided for reference, research or recordkeeping purposes. It is not subject to the Government of Canada Web Standards and has not been altered or updated since it was archived. Please "contact us" to request a format other than those available.
Released: 2019-04-17
March 2019
1.9% 
(12-month change)
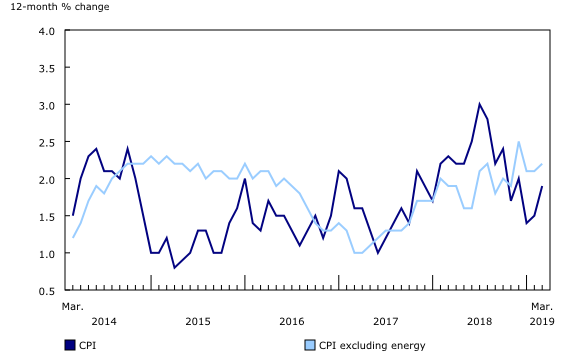
The Consumer Price Index (CPI) rose 1.9% on a year-over-year basis in March, up from a 1.5% increase in February. Energy prices decreased 1.2% in March, following a larger decline in February (-5.7%), as downward pressure from gasoline prices eased and prices for natural gas and fuel oil grew. Excluding energy, the CPI rose 2.2% year over year.
Component highlights
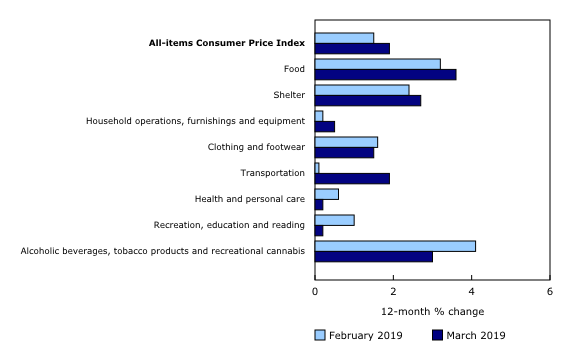
Prices increased year over year in all eight major components. The transportation index (+1.9%) drove the all-items CPI increase, as gasoline prices declined less in March than in February.
The year-over-year decline in energy prices slowed in March. Gasoline prices declined 4.4% after decreasing 11.9% in February, as higher global oil prices led to an 11.6% month-over-month increase in the gasoline index. The natural gas index increased 3.8% and prices for fuel oil and other fuels rose 2.6%. These increases were partially offset by slower growth in electricity prices (+2.2%) in March compared with February (+2.9%).
Prices for durable goods rose 1.2% in the 12 months to March, led by a 3.0% increase in the purchase of passenger vehicles index. The year-over-year increase was attributable to a 1.5% month-over-month decline in March 2018, when manufacturers increased rebates for new vehicles.
In March, prices for services rose 2.2% year over year after a 2.3% increase in February. The travel tours index declined 6.4%, reaching a lower seasonal peak than in 2017 and 2018. Consumers paid 6.5% less for traveller accommodation compared with the same month a year earlier. At the same time, air transportation prices increased 2.5% year over year.
Regional highlights
On a year-over-year basis, the CPI increased in every province in March. This price growth was most pronounced in Alberta (+2.3%), New Brunswick (+1.6%) and Prince Edward Island (+1.0%). The gains in these provinces were led by higher prices month-over-month for gasoline, as well as higher natural gas prices in Alberta.
Among the provinces, natural gas prices rose the fastest year over year in Alberta (+22.8%), contributing to a 3.9% increase in shelter costs in the province. This was partially offset by slower growth in electricity prices in March (+15.0%) than in February (+19.9%).
While fresh vegetables (+15.7%) and fresh fruit (+8.6%) led the year-over-year gain in the food index at the Canada level, price increases for food in Manitoba and Saskatchewan were smaller in March than in February. In both provinces, year-over-year growth in meat prices slowed.
Seasonally adjusted monthly Consumer Price Index
On a seasonally adjusted monthly basis, the CPI rose 0.3% in March, following a 0.4% increase in February. For the second consecutive month, the transportation index (+1.2%) posted the largest increase, while the clothing and footwear index declined 0.4% month over month.
Note to readers
Check out the new Consumer Price Index Data Visualization Tool!
This dashboard provides access to current and historical CPI data in a dynamic and customizable format. Check out the latest CPI snapshot to find out what's currently driving price changes in the CPI. Explore key CPI indicators and compare price changes of all the goods and services in the CPI basket over time and by geography.
This web-based application is updated monthly with the release of the CPI.
Visit our new interactive Consumer Price Index Data Visualization Tool.
User consultation
Statistics Canada is planning a series of user consultations on the CPI program. If you are a user of the CPI and wish to participate, please send an email to statcan.cpddisseminationunit-dpcunitedediffusion.statcan@canada.ca with your name, organization and contact information.
Real-time data tables
Real-time data table 18-10-0259-01 will be updated on April 29.
Next release
The Consumer Price Index for April will be released on May 15.
Products
The interactive Consumer Price Index Data Visualization Tool is available on the Statistics Canada website.
More information about the concepts and use of the Consumer Price Index (CPI) is available in The Canadian Consumer Price Index Reference Paper (62-553-X).
For information on the history of the CPI in Canada, consult the publication Exploring the First Century of Canada's Consumer Price Index (62-604-X).
Two videos, "An Overview of Canada's Consumer Price Index (CPI)" and "The Consumer Price Index and Your Experience of Price Change," are available on Statistics Canada's YouTube channel.
Contact information
For more information, or to enquire about the concepts, methods or data quality of this release, contact us (toll-free 1-800-263-1136; 514-283-8300; STATCAN.infostats-infostats.STATCAN@canada.ca) or Media Relations (613-951-4636; STATCAN.mediahotline-ligneinfomedias.STATCAN@canada.ca).
- Date modified:


