Infrastructure Economic Account, 2018
Archived Content
Information identified as archived is provided for reference, research or recordkeeping purposes. It is not subject to the Government of Canada Web Standards and has not been altered or updated since it was archived. Please "contact us" to request a format other than those available.
Released: 2019-04-11
The value of Canada's stock of public and private infrastructure stood at $852 billion in 2018, up $47 billion from 2017. The 2018 level represented 7.7% of national wealth. In real (volume) terms, this was a 2.7% increase in the stock of infrastructure from the previous year and was 37.4% higher than in 2009, the first year of available data.
Investment in infrastructure totalled $85.8 billion in 2018, representing 25.9% of all non-residential investment in Canada. Over 585,000 jobs were associated with the production of infrastructure assets in 2018, 17,000 more jobs than in 2017.
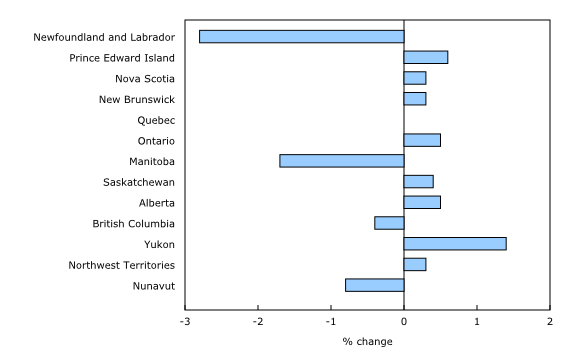
In real terms, public and private investment in infrastructure in Canada was relatively unchanged in 2018 after a substantial 6.8% increase in 2017. More than half of the provinces and territories saw increased investment in 2018, while Quebec was unchanged. Yukon had the largest increase at 1.4%. There were notable investment slowdowns in Newfoundland and Labrador (-2.8%) and Manitoba (-1.7%).
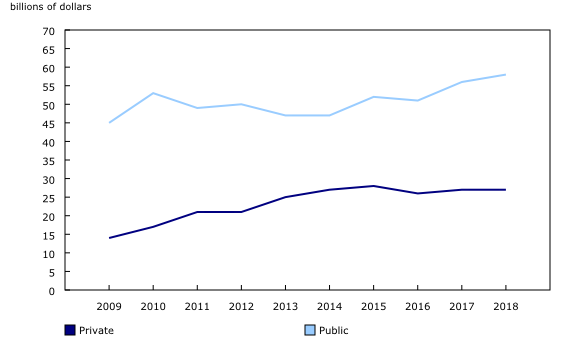
Public investment in infrastructure rose 0.8% in 2018 following an 8.0% increase in 2017. Only Newfoundland and Labrador and Manitoba had lower public infrastructure investment in 2018. Private investment in infrastructure was down in every province and territory except Saskatchewan (+0.8%). Nationally, private infrastructure investment declined 1.6%, following a 4.3% increase the previous year. In general, a larger portion of infrastructure investment originates from the public sector, representing on average about two-thirds of the total.
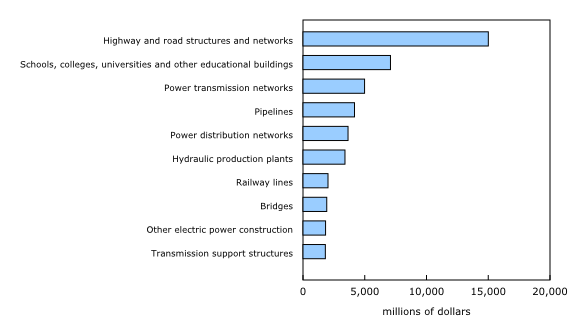
In Canada, highways and road structures and networks received the largest share of investment, which supports the service of transportation. In 2018, investment in highways and road structures and networks accounted for over one-fifth (22.5%) of total infrastructure investment in Canada. Exceptions include Newfoundland and Labrador and Manitoba, which have a larger share of investment in power transmission networks, for British Columbia it was pipelines, while in Yukon and Northwest Territories, a larger share was invested in hospitals.
Remaining useful service life increases in most provinces
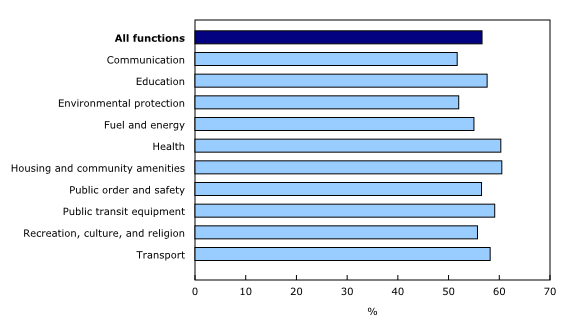
The share of remaining useful service life of infrastructure is an indicator of the time that a group of assets will continue to function and provide economic benefits. The closer the estimate is to 100% the greater the share of their useful economic life remains. The remaining useful service life of infrastructure assets edged up from 56.3% in 2017 to 56.6% in 2018. The majority of the provinces and territories reported increases in 2018, while Prince Edward Island and New Brunswick were essentially unchanged.
Most infrastructure assets increased their shares of remaining useful service life from 2009 to 2018. The share for power and distribution transformers rose sharply, from 37.2% in 2009 to 46.5% in 2018.
Infrastructure investment contribution to gross domestic product increases
Investment in infrastructure assets can result in a significant contribution to Canada's economy, as these often large projects have impacts throughout many industries. For example, investment in a bridge not only contributes to the output of the construction industry but also to the cement industry, sand and gravel industry and a host of service industries that provide inputs to the project. The direct and indirect economic contribution from public and private infrastructure investment increased by $1.7 billion from 2017 to $64.2 billion in 2018, with direct investment accounting for 56% of the total and indirect 44%.
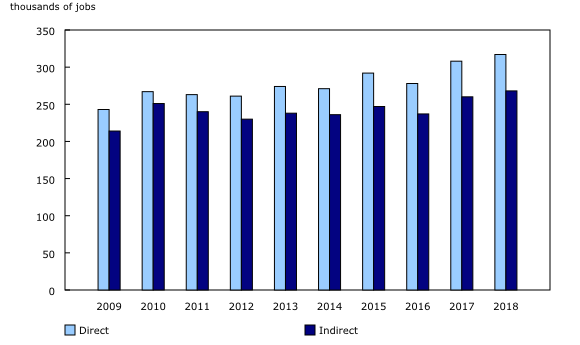
Over 585,000 jobs were associated with the production of infrastructure assets in 2018, 17,000 more jobs than in 2017. Most provinces and territories had more jobs from infrastructure investment in 2018 than in 2017. Nationally, 54% of the total jobs were the result of direct investment, while 46% were indirect from spin-offs in other industries.
Note to readers
The infrastructure economic accounts presents information related to the size, role and economic impact of infrastructure on the Canadian economy and that of the provinces and territories. Infrastructure assets are the physical structures and systems that support the production of goods and services, and their delivery to and consumption by governments, businesses and citizens. Data from the infrastructure economic accounts is available from 2009 to 2018.
This release incorporates revisions from the annual provincial-territorial economic accounts released on November 30, 2018. Consistent with the latest economic accounts release, the reference year for estimates in real terms for the infrastructure economic accounts was changed from 2007 to 2012. Unless otherwise noted, estimates of stock are presented on a net basis (net of depreciation). Revised and updated estimates are also available on the Infrastructure Statistics Hub.
Products
The product Infrastructure Statistics Hub (71-607-X) is now available.
The Latest Developments in the Canadian Economic Accounts (13-605-X) is available.
The User Guide: Canadian System of Macroeconomic Accounts (13-606-G) is available.
The Methodological Guide: Canadian System of Macroeconomic Accounts (13-607-X) is available.
Contact information
For more information, or to enquire about the concepts, methods or data quality of this release, contact us (toll-free 1-800-263-1136; 514-283-8300; STATCAN.infostats-infostats.STATCAN@canada.ca) or Media Relations (613-951-4636; STATCAN.mediahotline-ligneinfomedias.STATCAN@canada.ca).
- Date modified:


