Household actual final consumption
Archived Content
Information identified as archived is provided for reference, research or recordkeeping purposes. It is not subject to the Government of Canada Web Standards and has not been altered or updated since it was archived. Please "contact us" to request a format other than those available.
Released: 2019-03-20
Statistics Canada is releasing new measures of household actual final consumption. These new measures supplement traditional estimates of household consumption expenditure by including "social transfers in kind"—the value of services and some specific goods that are financed by governments and non-profit institutions and that are consumed by households. These services include health and education, along with a range of other categories.
The provision of these services to households can also be measured as income, provided to the user in kind rather than as a money transfer. The broader corresponding income concept is referred to as "adjusted disposable income."
These new measures are in line with international standards, which recommend including social transfers in kind to calculate supplementary measures of consumption and income. The measures facilitate cross-national comparisons, as social transfers in kind consumed by households are financed to varying degrees across countries.
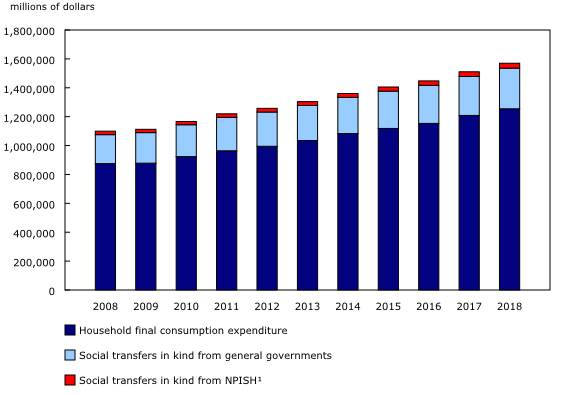
Social transfers in kind represent about one-fifth of actual household consumption
Social transfers in kind—the value of services provided by governments and non-profit institutions to households—increased steadily from $224 billion in 2008 to $315 billion in 2018 (nominal terms). Over the 10-year period, nominal growth ranged from 2.6% to 5.1% from year to year. As a proportion of total household consumption, social transfers in kind have remained relatively stable at about 20%. Most social transfers in kind are financed by governments, representing $281 billion in 2018, while those financed by non-profit institutions accounted for $34 billion.
Health and education dominate
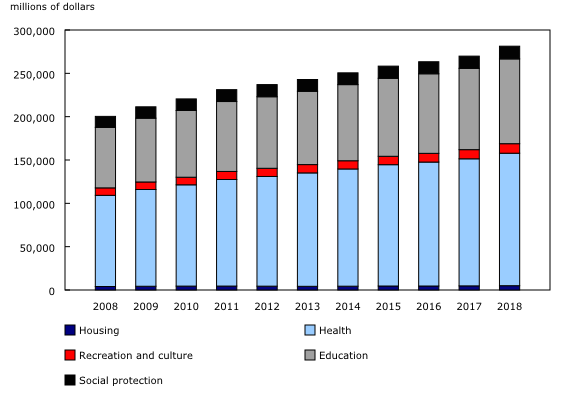
Social transfers in kind from governments are primarily composed of health and education services, which account for 90% of the government transfers in kind. Health services represent just over half, and their share edged up from 52.5% in 2008 to 54.3% in 2018. Education services were the second largest category (34.8%), and have remained stable over the 10-year period.
Non-profit institutions provide different services than governments
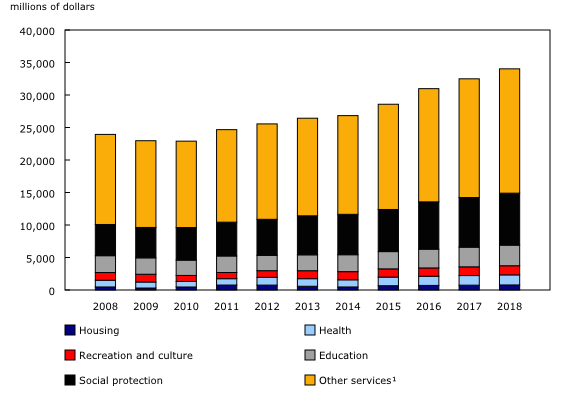
Although the nominal value of the services they provided in kind is small in relation to governments, non-profit institutions generally offered different types of services. These include social protection, such as childcare and old age protection, which accounted for $8.0 billion in 2018, as well as other services, such as religious services and those provided by grant-making and giving organizations.
Territories post the largest share of social transfers in kind in household actual consumption
Annual data for the provinces and territories are available up to the year 2017.
Although relatively small in value, the territories had the largest share of social transfers in kind in household actual consumption, 52.7% in Nunavut, 38.8% in the Northwest Territories and 34.2% in Yukon in 2017, as services are more costly to provide in remote locations. In 2017, Nunavut's nominal social transfers in kind ($924 million) were higher than their household consumption expenditure ($830 million). Housing and social protection transfers were the leading categories. Housing was the highest in Nunavut at 10.4% of household actual consumption, while social protection was the highest in the Northwest Territories (4.9%) in 2017.
Among the provinces, Manitoba had the highest share of social transfers in kind in household actual consumption at 24.8% in 2017 and British Columbia had the lowest share (16.4%). Consistent across time and provinces, health and education functions remain the largest transfers in kind.
Sustainable Development Goals
On January 1, 2016, the world officially began implementation of the 2030 Agenda for Sustainable Development—the United Nation's transformative plan of action that addresses urgent global challenges over the next 15 years. The plan is based on 17 specific sustainable development goals.
Data on household actual final consumption are an example of how Statistics Canada supports the reporting on the Global Goals for Sustainable Development. This release will be used in helping to measure the following goal:

Note to readers
Household actual final consumption consists of the consumption of goods and services acquired by individual households. The value of household actual final consumption is given by the sum of three components: a) the value of households' expenditures on consumption of goods or services including expenditures on non-market good or services sold at prices that are not economically significant; b) the value of the expenditures incurred by government units on individual consumption of goods or services provided to households as social transfers in kind; and c) the value of the expenditures incurred by non-profit institutions serving households on individual consumption of goods or services provided to households as social transfers in kind.
Social transfers in kind add valuable information to the understanding of social inequality, especially in international comparisons. Hence it will be integrated into the upcoming release of the Distributions of Household Economic Accounts (DHEA) on March 27, 2019, and will continue to be part of the DHEA. The DHEA provides additional granularity to address questions such as vulnerabilities of specific groups and the resulting implications for economic wellbeing and financial stability. It is recommended to incorporate the national accounts concept of adjusted disposable income into distributional household data.
Statistics Canada produces the Canadian government finance statistics program which is designed to measure and analyze the economic dimensions of the public sector of Canada. Government expenses can benefit individual households or the community at large and the data can be presented by their main socioeconomic functions according to the Canadian Classifications of Functions of Government, which is a primary data source for Household actual final consumption.
Products
Details on the sources and methods behind these estimates can be found in Methodological Guide: Canadian System of Macroeconomic Accounts (13-607-X). See section "Household Actual Final Consumption" under Satellite Accounts and Special Studies.
Disseminated detail estimates are available for household actual final consumption and adjusted household disposable income.
The Latest Developments in the Canadian Economic Accounts (13-605-X) is available.
The User Guide: Canadian System of Macroeconomic Accounts (13-606-G) is available.
Contact information
For more information, or to enquire about the concepts, methods or data quality of this release, contact us (toll-free 1-800-263-1136; 514-283-8300; STATCAN.infostats-infostats.STATCAN@canada.ca) or Media Relations (613-951-4636; STATCAN.mediahotline-ligneinfomedias.STATCAN@canada.ca).
- Date modified:


