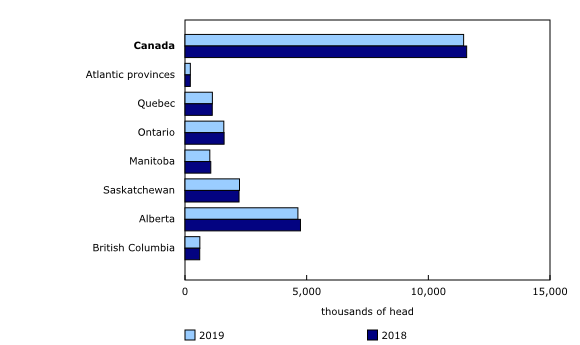
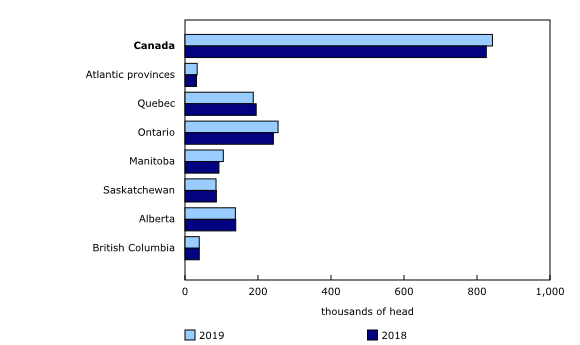
Livestock estimates, January 1, 2019
Archived Content
Information identified as archived is provided for reference, research or recordkeeping purposes. It is not subject to the Government of Canada Web Standards and has not been altered or updated since it was archived. Please "contact us" to request a format other than those available.
Released: 2019-03-01
Cattle and hog inventories were down on January 1 compared to January 1, 2018. This was the first year-over-year (from January to January) decrease for the hog inventories since January 2013. With the exception of a few small increases, cattle inventories have been declining since January 2005. Meanwhile, sheep inventories increased for the second consecutive year.
Cattle
On January 1, Canadian farmers had 11.5 million cattle on their farms, down 1.1% from January 1, 2018. Inventories were 23.3% below their peak level in January 2005.
Cattle producers retained less breeding stock in 2018, as the number of beef heifers held for breeding on Canadian farms was down 1.4% to 553,800 head compared with the same date a year earlier. The number of beef cows decreased 1.0% to 3.7 million head. The inventory of calves on January 1 decreased 1.3% to 3.7 million head. The number of feeder heifers increased 1.2%, while the number of steers decreased 3.4% from January 1, 2018.
As of January 1, 72,420 farms reported inventories of cattle and calves, down 1.6% from January 1, 2018, and 3.1% lower compared with the same date in 2017. Canadian farmers had 1.4 million dairy cows and heifers on their farms, up 0.3% from January 1, 2018.
Total disposition of cattle rose 1.6%, driven by higher cattle slaughter levels during the second half of 2018 compared with the same period in 2017. Total cattle slaughter rose 3.1% to 1.8 million head in the second half of 2018, marking the third consecutive year-over-year increase. International exports of cattle decreased 2.3% to 295,100 head during the second half of 2018 compared with the same period in 2017.
Canadian slaughter cattle prices were lower on average during the second half of 2018 compared with the same period in 2017.
Hogs
Hog producers reported 14.0 million hogs, down 1.0% from January 1, 2018, and the first year-over-year (from January to January) decrease in six years. However, the hog inventory remained 10.1% above the January 1, 2013 level. As of January 1, there were 8,060 farms reporting hogs in Canada, down 1.3% from the same date a year earlier. These farms reported 1.2 million sows and gilts, down 0.1% from January 1, 2018.
Canada exported 2.6 million hogs in the second half of 2018, down 4.2% from the same period in 2017, while exports were 51.7% below their peak level during the same period in 2007.
Hog slaughter in Canada decreased 1.1% from the second half of 2017 to 10.8 million head in the second half of 2018.
The July-to-December 2018 pig crop was 14.0 million head, down 1.7% from the same period in 2017.
Canadian hog prices decreased in the second half of 2018 compared with the same period in 2017.
Sheep
Canadian farmers held 842,300 sheep and lambs on January 1, 2019, up 2.0% compared with the same date in 2018 and the second consecutive year-over-year increase (from January to January).
The sheep breeding herd increased, as the number of ewes grew 1.8% to 523,000 head and replacement lambs were up 2.9% to 81,200 head. The number of rams edged up 0.4%, to 23,700 head. The number of market lambs increased 2.6% from January 1, 2018, to 214,400 head.
International exports of sheep decreased to 800 head in the second half of 2018, down 33.3% from the same period in 2017.
Canadian lamb prices decreased in the second half of 2018 compared with the same period in 2017.
Note to readers
Livestock estimates are available for Canada and the provinces as well as for the United States.
Due to the US government shutdown, the transmission of international trade data has been delayed. Consequently, the international trade data in tables 32-10-0139-01, 32-10-0141-01 and 32-10-0147-01 has been estimated for December 2018.
Due to the US government shutdown, the transmission of US livestock inventories has been delayed. Consequently, tables 32-10-0140-01 and 32-10-0143 will be published once the data become available.
Contact information
For more information, or to enquire about the concepts, methods or data quality of this release, contact us (toll-free 1-800-263-1136; 514-283-8300; STATCAN.infostats-infostats.STATCAN@canada.ca) or Media Relations (613-951-4636; STATCAN.mediahotline-ligneinfomedias.STATCAN@canada.ca).
- Date modified:


