
Fruit and vegetable production, 2018

Archived Content
Information identified as archived is provided for reference, research or recordkeeping purposes. It is not subject to the Government of Canada Web Standards and has not been altered or updated since it was archived. Please "contact us" to request a format other than those available.
Released: 2019-02-22
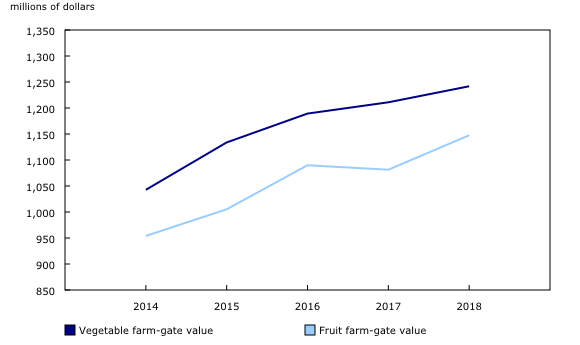
The farm-gate value of fruits and vegetables produced in Canada increased 4.2% in 2018 to $2.4 billion. This gain was mainly the result of a 6.1% rise in the value of fruit, which accounted for about half of the total farm-gate value of fruits and vegetables.
The value of vegetables was up for the eighth consecutive year to $1.2 billion in 2018.
Vegetables
The value of vegetables rose 2.5% in 2018 to $1.2 billion. Together, carrots, tomatoes, dry onions, lettuce, sweet corn, broccoli and peppers represented more than half of the total value of field vegetables grown in Canada. Carrots recorded the highest value ($129.9 million), followed by tomatoes ($105.5 million), dry onions ($94.6 million), lettuce ($82.9 million), sweet corn ($76.4 million), broccoli ($74.4 million) and peppers ($68.8 million).
Kale is an emerging commodity in Canada. According to data from the Census of Agriculture, published in the article "Innovation and healthy living propel growth in certain other crops," the cultivated area for kale increased 389.9% from 2011 to 2016. In 2018, farmers cultivated 252.0 hectares of kale, with a farm-gate value of $5.5 million.
Cultivated area for vegetables totalled 103 222 hectares in 2018, with Ontario, Quebec and British Columbia accounting for 90.9% of the area.
Chart 1

Farm-gate value of fruits and vegetables
Fruits
The total value of fruit increased 6.1% in 2018 to $1.1 billion, mainly as a result of gains for blueberries and cranberries.
Marketed production of low bush blueberries was down 16.5% in 2018. A spring frost in the Maritimes may have affected production. However, the value of low bush blueberries rose 13.3% in 2018 to $66.5 million, as prices rose 35.7%. Despite the increase, prices were still below their five-year average.
The value of high bush blueberries rose 13.8% to $177.4 million in 2018, as marketed production grew 10.3% and prices were up 3.1%.
The value of cranberries grew 25.0% to $143.6 million in 2018, mainly as a result of a 41.0% increase in production to 177 079 tonnes. Quebec, which produced 64.3% of all cranberries in Canada, was largely responsible for the gain.
The value of apples, which accounted for 20.4% of the total value of fruit in 2018, increased 2.0% to $233.6 million. The gain was due to an increase in production, which edged closer to its five-year average, following lower-than-average levels in 2017.
In 2018, the value of grapes—which represented 16.4% of the total value of fruit in Canada—decreased 2.2% to $188.0 million. The decline was due to lower marketed production (-8.3%), as prices rose 6.6%. Warm summer temperatures in 2018, particularly in the Niagara region, resulted in good quality grapes for wine production. The price of vinifera grapes increased 6.4% to $1.72 per kilogram in 2018, higher than the average price for the previous five years.
Data are available for the first time for blackberries, currants and haskaps. The value of blackberries was $5.1 million in 2018, while the value of currants and haskaps together totalled just under $1.5 million.
Note to readers
As of 2018, kale is included in the "total cabbages" category. Prior to 2018, it was included in "other vegetables."
Prior to 2018, eggplants, kale, other herbs and sweet potatoes were included in "other vegetables."
Prior to 2018, blackberries, currants (black currants, red currants and white currants) and haskaps were included in the "other fruit" category.
Farm-gate value is the value received by producers at the point of first transaction, when ownership first changes hands. This value excludes any separately billed costs such as delivery, storage, marketing and administrative.
Changes in methodology were made to the Fruit and Vegetable Survey beginning in 2018. For more information on the methodology changes, consult the webpage for the Integrated Business Statistics Program, available in the Behind the data feature of our website.
Contact information
For more information, contact us (toll-free 1-800-263-1136; 514-283-8300; STATCAN.infostats-infostats.STATCAN@canada.ca).
To enquire about the concepts, methods or data quality of this release, contact Serge DesRoches (613-866-6924; serge.desroches@canada.ca), Agriculture Division.
- Date modified: