Ecosystem accounting: Renewable freshwater for selected geographic areas, 1971 to 2014
Archived Content
Information identified as archived is provided for reference, research or recordkeeping purposes. It is not subject to the Government of Canada Web Standards and has not been altered or updated since it was archived. Please "contact us" to request a format other than those available.
Released: 2018-12-10
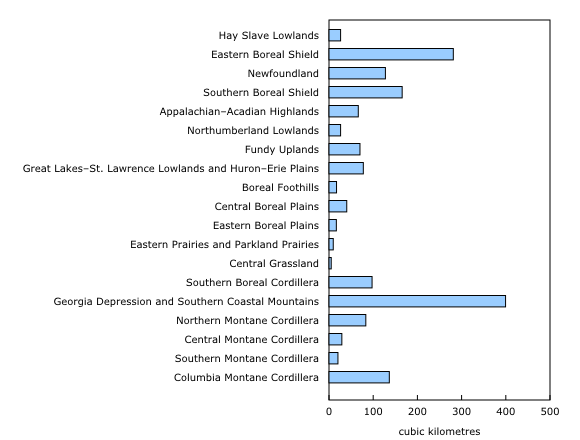
Freshwater is generated unevenly across Canada's landscape. Water yield—the volume of freshwater generated—is highest on the West Coast, while much smaller volumes are generated on the Prairies. The Georgia Depression and the Southern Coastal Mountains ecoprovinces of the Pacific Maritime ecozone had an average annual water yield of 399.5 km3 from 1971 to 2014—nearly 80 times greater than the 5 km3 water yield of the Central Grassland ecoprovince on the Prairies.
The Great Lakes–St. Lawrence Lowlands and Huron–Erie Plains ecoprovinces, which include Montréal, Toronto and Ottawa, produced a combined average of 77.6 km3 of freshwater per year. On the East Coast, the Newfoundland ecoprovince generated an average of 127.6 km3 of freshwater annually, which was the fifth highest among the ecoprovinces for which data were produced.
The variability in the supply of freshwater is greatest on the Prairies, particularly in the Eastern Prairies ecoprovince, which had the largest difference between maximum and median monthly water yields. The maximum monthly water yield for July was almost 30 times greater than the median yield over the 43-year period. The variability was lowest in the Southern Boreal Cordillera ecoprovince.
Note to readers
Statistics Canada is releasing two new tables that aggregate data on renewable freshwater resources to the ecoprovince level of the Ecological land classification geography. Annual time series and long-term (1971 to 2014) median, minimum and maximum monthly water yield data are now available in separate tables for selected ecoprovinces from 1971 to 2014.
Data on Canada's water yield has been previously released by drainage region; see tables 38-10-0283-01 (previously CANSIM table 153-0109) and 38-10-0003-01 (previously CANSIM table 153-0110). These data are produced as part of Statistics Canada's thematic ecosystem accounts, as described in Methodological Guide: Canadian System of Environmental-Economic Accounting (16-509-X).
Water yield is the amount of freshwater derived from unregulated flow measurements for a given geographic area over a defined period of time and is an estimate of renewable freshwater. Water yield also includes a volume of water that is not renewable, specifically that portion of glacial melt water coming from receding glaciers.
For more information on water yield, see the article "Freshwater in Canada," in Human Activity and the Environment (16-201-X) and "The Water Yield for Canada As a Thirty-year Average (1971 to 2000): Concepts, Methodology and Initial Results" as part of the Environment Accounts and Statistics Analytical and Technical Paper Series (16-001-M).
Contact information
For more information, contact us (toll-free 1-800-263-1136; 514-283-8300; STATCAN.infostats-infostats.STATCAN@canada.ca).
For analytical information, or to enquire about the concepts, methods or data quality, contact Mark Henry (613-883-1410; mark.henry@canada.ca), Environment, Energy and Transportation Statistics Division.
- Date modified:


