Wastewater-based estimate of cannabis consumption, March to August 2018
Archived Content
Information identified as archived is provided for reference, research or recordkeeping purposes. It is not subject to the Government of Canada Web Standards and has not been altered or updated since it was archived. Please "contact us" to request a format other than those available.
Released: 2018-11-29
Using municipal wastewater to measure cannabis consumption: A Canadian pilot study
Over the last two years, Statistics Canada has innovated significantly to collect data to track the role of cannabis in Canadian society and economy prior to and following the legalization of cannabis in October 2018.
One of the challenges in collecting statistics on cannabis is that there is a risk that people may under-report their consumption of cannabis, at least initially, in surveys conducted by the agency. Stigma associated with use and the reluctance to disclose purchases from non-regulated suppliers are two factors that could contribute to under-reporting.
One consequence of under-reporting is that the size of the black market for cannabis will be similarly underestimated. As a result, without a direct measurement of cannabis consumption, the reduction of the black market for cannabis, one of the objectives of the legalization of non-medical cannabis, will be hard to track.
Using new methods to overcome a statistical challenge
To mitigate this risk, Statistics Canada is exploring the use of a new technique called wastewater-based epidemiology (WBE) to produce statistics on cannabis. This new method has been used in Europe since 2007 to report on people's consumption of different drugs in large cities.
When people consume cannabis or tetrahydrocannabinol (THC), the main psycho-active constituent of cannabis, their bodies process the cannabis into metabolites (THC-COOH, in the case of THC) that are later eliminated from the body and typically flushed into the municipal wastewater system. Through direct analysis of the concentrations of THC-COOH in wastewater, Statistics Canada can estimate the total mass of cannabis consumed.
WBE is ideal because it is cost-effective, does not impose a response burden on Canadians or businesses, yields relatively rapid results and can be used on smaller areas, such as a city. It may also be used to estimate the size of the illegal cannabis market following legalization, by allowing Statistics Canada to subtract the volume of legal cannabis retail sales from total consumption as measured through WBE.
This release presents preliminary results from Statistics Canada's WBE pilot test, which has been ongoing since March 2018. In addition, the release contributes to scientific research in the field of WBE by exploring uncertainties and information gaps associated with it, and identifying areas where additional work is needed to produce better estimates of cannabis consumption.
A quick look at the methodology
From March to August 2018, Statistics Canada held one of the world's largest―if not the largest―continuous WBE pilot tests to date. The pilot project covered the catchment areas served by 15 wastewater treatment plants in five large urban centres across the country, representing nearly 8.4 million Canadians. The error bars on either side of the average values reflect the variability in the month-to-month load measurements and hence, the uncertainty of the estimates.
Each participating wastewater treatment plant was sampled continuously during the second week of each month. Sampling started in March 2018 and will continue through the spring of 2019. The analysis was validated by the Sewage Analysis Core Group Europe, a worldwide academic consortium specializing in WBE.
Still in the experimental stage
This is the first data release from the pilot project. Data cover the period from March to August 2018. Results are considered preliminary and experimental.
Statistics Canada is still exploring the benefits and limits of using WBE to produce statistics on drug use. Subsequent tests and results will allow the agency to better assess the long-term feasibility of using wastewater as an official data source.
Preliminary results
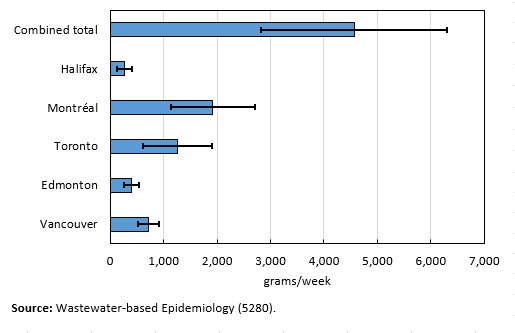
Analysis results yielded an "estimated load" of THC-COOH measured (in grams per week) at the 15 wastewater treatment plants included in the pilot project. This load represents the total chemical trace of cannabis found in the sampled wastewater. The error bars on either side of the average values reflect the variability in the month-to-month load estimates.
As expected, total load was influenced―at least in part―by the size of the population serviced by each wastewater treatment plant. Populous sites like those in Montréal, Toronto and Vancouver tended to produce higher loads. Halifax was the smallest site by far, and its load was correspondingly small.
Results for almost every site varied substantially from month to month. However, at this point, it is difficult to determine whether the variations were due to real changes in behaviour or to statistical phenomena related to sampling and flow rates.
The total load for all wastewater treatment plants combined averaged about 4.5 kilograms of THC-COOH per week from March to August 2018.
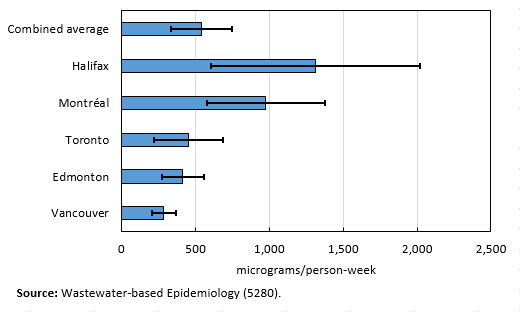
Meanwhile, the rate of cannabis use per capita was about 540 micrograms per person per week (mcg/person-week).
Among the larger cities excluding Montréal, the per capita rate was fairly consistent, at around 450 mcg/person-week. Wastewater treatment plants in Montréal and Halifax produced higher consumption rates per capita. However, the disparity may not necessarily reflect a true difference in consumption, but may be the result of sampling or statistical methodology.
For example, the wastewater treatment plant in Halifax was situated in the core area of the city and as a result, the consumption of cannabis measured there may not represent the city's entire metropolitan population.
In addition, differences in temperature, acidity and the presence of industrial chemicals or bacteria in the sewer system of each city could have an impact on the amount of cannabis detected in wastewater and affect the comparability of data from different cities.
Furthermore, the month-to-month variation in loads is large. For example, because of the amount of monthly variation in Halifax, it can only be expected that the true annual usage is contained within the bounds of 603 mcg/person-week and 2,018 mcg/person-week two-thirds of the time. Given this large range of uncertainty, it is all the more difficult to make comparisons between cities with very much confidence.
Statistics Canada will continue to collect more data from each participating wastewater treatment plant to assess whether the rates differ as a result of true differences in consumption rates, or as a result of methodology.
Using wastewater drug loads to estimate consumption
Data on the amount of cannabis metabolite detected in wastewater could potentially help track changes in use over time or between geographic areas. However, this measure cannot be used on its own to determine how much cannabis is consumed by Canadians.
To produce such estimates, Statistics Canada needs additional information, such as the proportion of the drug (or its metabolite) that is excreted, drug potency, and the way the drug is consumed. In the case of cannabis, there are many different kinds of products, with different THC potency levels, and this adds further complexity to estimation methods.
There is significant international research underway on how to improve wastewater-based analysis of non-medical drugs. Statistics Canada is encouraging the development of common techniques to make results comparable over time, between different cities and between countries.
In December 2017, Statistics Canada released its first estimates of cannabis consumption―not based on WBE―according to which Canadians had consumed 773 tonnes of cannabis in 2017. At the time of publication, the agency acknowledged that the figure may have been under-reported and that it should therefore be used as the lower limit of an estimated range.
The following text discusses preliminary estimates of cannabis consumption based on the use of WBE and the most current internationally supported techniques.
The average load of THC-COOH across all sites was 540 mcg/person-week, which, when multiplied by 52 weeks, produced an average annual load of 28,100 mcg per person.
This was then multiplied to take into account Canada's estimated population of 37 million, yielding an estimated total load to 1.04 tonnes of THC-COOH. (The pilot project covered 8.4 million people, representing 23% of Canada's population. For the purposes of this study, it was assumed that the cannabis-related behaviour of this sample population was representative of the rest of Canada.)
The derived load was then multiplied by the correction factor. The correction factor depends on the molecular mass of the cannabis and the excretion rate (how much of the cannabis leaves the body as metabolite after the cannabis is consumed). The agency used an assumed excretion rate of THC-COOH of 0.5%, but cautions users that this rate could be as high as 2.0%.
Finally, Statistics Canada divided the corrected load by the cannabis potency―the amount of THC per gram of product. The potency rates were based on a range of values to account for the variety of cannabis products consumed.
Using this methodology, the agency produced estimates of total cannabis consumed in tonnes per year and grams per day, given the range of potency for dried cannabis flower/leaf, and under two different assumptions about excretion rate (table 2).
As can be seen in table 2, annual cannabis consumption is highly sensitive to the excretion rate and THC potency, hence the need for more research into these factors before WBE can be used to make a confident estimate of total national cannabis consumption.
For example, for cannabis with 12% potency (weight of THC in total weight of cannabis), the total estimated consumption for 2018 can range between 400 and 1 600 tonnes, depending on the excretion rate that is used. As the parameters for cannabis potency and excretion rates are refined, as additional months of data are collected, and as the sources of variation are better understood, the quality of estimates of cannabis consumption will improve substantially.
More information on the methodology used for producing statistics from WBE will be available in a methodology paper shortly.
Note to readers
Contributions
Wastewater analysis and professional advice were provided by Dr. Viviane Yargeau and the laboratory in the Department of Chemical Engineering at McGill University, which is part of the Sewage Analysis Core Group Europe network.
Professional advice and collection, storage and transmission of wastewater samples were provided by wastewater treatment plants in the five participating metropolitan areas.
The contribution of these partners is greatly appreciated and is an important part of the wastewater-based epidemiology pilot project and research.
References
The assumed excretion rate was taken from "Refining correction factors for back-calculation of illicit drug use," part of Science of the Total Environment (2016) (authors Gracia-Lor, E., Zuccato, E., Castiglioni, S.).
The estimated values for the cannabis potency were taken from "Changes in Cannabis Potency over the Last Two Decades (1995-2014) – Analysis of Current Data in the United States," part of Biological Psychiatry (2016) (authors ElSohly, M.A., Mehmedic, Z., Foster, S., Gon, C., Chandra, S., Church, J. C.).
Preliminary estimates on 2017 cannabis consumption were taken from Statistics Canada's Volume of Cannabis Consumed in Canada (13-607-X).
Contact information
For more information, or to enquire about the concepts, methods or data quality of this release, contact us (toll-free 1-800-263-1136; 514-283-8300; STATCAN.infostats-infostats.STATCAN@canada.ca) or Media Relations (613-951-4636; STATCAN.mediahotline-ligneinfomedias.STATCAN@canada.ca).
- Date modified:


