The underground economy in Canada, 2016
Archived Content
Information identified as archived is provided for reference, research or recordkeeping purposes. It is not subject to the Government of Canada Web Standards and has not been altered or updated since it was archived. Please "contact us" to request a format other than those available.
Released: 2018-10-12
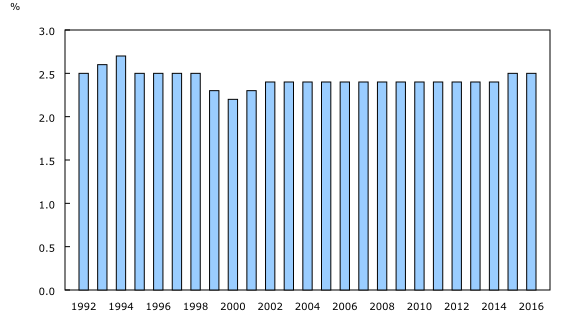
Underground economic activity in Canada totalled $51.6 billion in 2016, or 2.5% of gross domestic product (GDP). Since 1992—the starting point for this study—the underground economy as a proportion of GDP has been relatively stable, reaching a high of 2.7% in 1994 and a low of 2.2% in 2000.
The underground economy can be defined as consisting of market-based economic activities, whether legal or illegal, that escape measurement because of their hidden, illegal or informal nature.
For the purposes of this study, some illegal activities, such as those related to drugs and prostitution, are excluded. However, estimates of illegal production and consumption of cannabis are available in the table Cannabis supply, use and gross domestic product. The GDP associated with illegal cannabis in Canada was estimated to be $3.3 billion in 2016. If illegal cannabis had been added to the estimates in this study, the upper bound of underground economic activity, as a proportion of total GDP, would have been 0.2 to 0.3 percentage points higher each year since 1992.
The underground economy in Canada increased 3.5% from 2015 to 2016—higher than the 2.0% growth in total economy GDP. In real terms (that is, with price changes removed) the underground economy increased 1.8%, while the total economy was up 1.4%.
The main difference between growth in the underground economy and the overall economy in 2015 and 2016 was related to the weakening of the oil and gas sector and, in particular, contractions in investment in machinery and equipment and in intellectual property. While these economic conditions applied notable downward pressure on total GDP, they were not significant contributors to the underground economy.
Residential construction remains the top contributor to underground activity
In 2016, three industries accounted for more than half of underground economic activity: residential construction (26.6%), retail trade (13.5%) and accommodation and food services (12.1%). These industries have continued to be the main contributors to underground economic activity in Canada since 1992—the first reference year of this study.
Wages and undeclared tips accounts for largest share of unreported income
Of the $51.3 billion in unreported income in 2016, the largest share went to employees (46.8%) in the form of labour compensation. Wages not accounted for in payroll records and tips on undeclared transactions totalled $24.2 billion in 2016, equivalent to 2.3% of official compensation of employees. This amount represented $1,669 for every job in the business sector in 2016.
The remaining portion of underground income went to incorporated business owners (28.3%) and unincorporated business owners (25.0%).
Food and beverage services the largest category for underground household expenditures
In 2016, underground economic activity associated with household final consumption expenditure totalled $2,198 per household. Most of the underground activity was associated with household purchases of food and beverage services ($469), rental fees for housing ($439), tobacco ($229), alcoholic beverages ($178) and the operation of transportation equipment ($127), which includes vehicle maintenance and repair services.
Investment spending in residential structures (26.7%), which includes new construction and renovations, followed by net exports (7.7%), accounted for the remaining proportion of the underground economy from the expenditure-GDP perspective.
Underground economy by province and territory
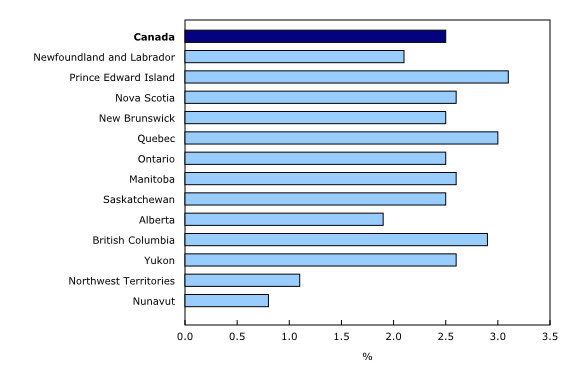
The total value of underground economic activity in 2016 was highest in the four largest economies: Ontario ($19.7 billion), Quebec ($11.9 billion), British Columbia ($7.6 billion) and Alberta ($5.8 billion).
As a proportion of total economy GDP, underground economic activity was the largest in Prince Edward Island, while it was smallest in Nunavut and the Northwest Territories.
The underground economy accounted for 3.1% of total economy GDP in Prince Edward Island in 2016. Industries that are more prone to underground activity, such as retail trade and accommodation and food services, make up a larger share of Prince Edward Island's economy compared with other provinces and territories. Conversely, industries such as mining, quarrying and oil and gas extraction, which tend to have a lower incidence of underground activity, are less important in Prince Edward Island's economy.
As a proportion of total economy GDP, Nunavut (0.8%) and the Northwest Territories (1.1%) had the smallest underground economies. This study assumes that there is no underground economic activity in the government sector, which makes up a large share of the economies of Nunavut and the Northwest Territories.
Note to readers
Available today are new estimates of the underground economy by province and territory for 2014 to 2016. Revised estimates for reference years 2010 to 2013 are also available. Data for 2007 to 2009 have not been revised. At the national level, unrevised estimates are available back to 1992.
All estimates in this release are expressed in current nominal dollars unless otherwise stated. The study provides estimates adjusted for inflation at the national level, but not by province or territory.
The underground economy can be defined as consisting of market-based economic activities, whether legal or illegal, that escape measurement because of their hidden, illegal or informal nature. For the purpose of this study, some illegal activities, such as those related to drugs and prostitution, have been excluded. However, estimates of illegal production and consumption of cannabis are available in the table Cannabis supply, use and gross domestic product.
The study presents underground economy estimates based on the three methods of measuring gross domestic product (GDP): the expenditure-based approach, the income-based approach and the industry-based approach.
Readers should be careful in interpreting the results of this study. First, estimates presented give an upper bound, as recommended by the Organisation for Economic Co-operation and Development Handbook on Measuring the Non-observed Economy. To derive these bounds, assumptions were made to estimate the maximum potential underground activity beyond what is already included in GDP using standard methods.
Second, by its very nature, it is difficult to obtain information on the underground economy, so that the estimates necessarily rely on assumptions, indicative information and various indirect methods.
Third, official GDP already includes some implicit and explicit adjustments for underground activity. For these reasons, the estimates calculated in this study cannot simply be added to the official GDP to arrive at a measure of GDP including the underground economy.
Products
Data tables for the provinces and territories from 2007 to 2016, and for Canada from 1992 to 2016, are available upon request.
The reference papers "Methodology for measuring the underground economy by province and territory," as part of the Latest Developments in the Canadian Economic Accounts (13-605-X), and "The Underground Economy in Canada, 1992 to 2011," as part of the Income and Expenditure Accounts Technical Series (13-604-M), are available.
The Latest Developments in the Canadian Economic Accounts (13-605-X) is available.
The User Guide: Canadian System of Macroeconomic Accounts (13-606-G) is available.
The Methodological Guide: Canadian System of Macroeconomic Accounts (13-607-X) is available.
Contact information
For more information, or to enquire about the concepts, methods or data quality of this release, contact us (toll-free 1-800-263-1136; 514-283-8300; STATCAN.infostats-infostats.STATCAN@canada.ca) or Media Relations (613-951-4636; STATCAN.mediahotline-ligneinfomedias.STATCAN@canada.ca).
- Date modified:


