Infrastructure Economic Account, 2017
Archived Content
Information identified as archived is provided for reference, research or recordkeeping purposes. It is not subject to the Government of Canada Web Standards and has not been altered or updated since it was archived. Please "contact us" to request a format other than those available.
Released: 2018-09-13
The value of Canada's stock of infrastructure was $933 billion in 2017, or 8.7% of total national wealth. In real terms, the stock of infrastructure increased 1.1% over 2016 and was 11.6% higher than in 2009.
In 2017, investment in infrastructure totalled $78.5 billion, representing 24.1% of all non-residential investment in Canada. Over 547,000 jobs were generated from the production of infrastructure assets in 2017, up slightly from around 545,000 jobs in 2016.
Infrastructure contributes 8.7% to Canada's national wealth
The value of Canada's stock of infrastructure was $933 billion in 2017, or 8.7% of total national wealth. In real terms, the stock of infrastructure increased 1.1% over 2016 and was 11.6% higher than in 2009, the first year of available data.
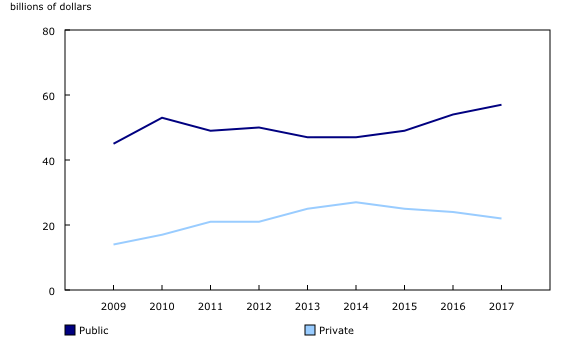
Overall, in real terms, investment in infrastructure declined 1.8% in 2017, following an increase of 6.0% in 2016. Although more than half of the provinces and territories had increased investment in 2017, notable slowdowns occurred in Alberta (-10.8%) and the Northwest Territories (-14.0%). In real terms, private investment in infrastructure declined in 10 provinces and territories in 2017 and fell 11.0% nationally. Public investment in infrastructure increased 2.1% in 2017, following a 10.2% gain in 2016.
From 2009 to 2017, highways and road structures and networks received the largest share of investment. In 2017, investment in highways and road structures and networks accounted for 21.8% of total infrastructure investment in Canada. However, this was not the case for all provinces and territories. Newfoundland and Labrador had larger investment in power transmission networks; Manitoba, in hydraulic production plants; the Northwest Territories, in hospitals; and Nunavut, in schools, colleges, universities and other educational buildings.
The highest proportion of infrastructure investment in 2017 was undertaken by the utilities industries, while the transportation services industry was significant in Alberta and Ontario. The Northwest Territories recorded large investments in the information, finance and professional industries, while mining industries were important in Nunavut.
Remaining useful service life increases in most provinces
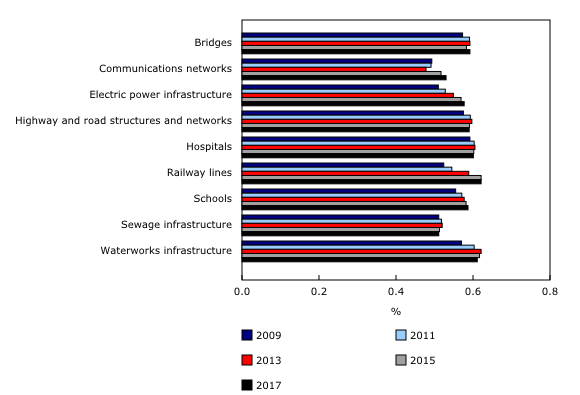
The share of remaining useful service life of infrastructure is the estimate of the percentage of time that an asset (or group of assets) will continue to function and provide economic benefits to Canada. The closer the estimate is to 100%, the better the state of infrastructure assets. After seven years of deceleration, the share of remaining useful service life of infrastructure assets was 57.7% in 2017, essentially unchanged from 2016. The majority of the provinces and territories showed increases in 2017, however there were decreases in Alberta, British Columbia, Saskatchewan, Prince Edward Island and Nunavut.
The share of remaining useful service life for highway and road structures and networks in Canada increased from 57.5% in 2009 to 59.0% in 2017. The share increased in seven provinces and one territory from 2009 to 2017. As a result of a slowdown in investment, waterworks and sewage infrastructure assets experienced a slight decrease in their share of remaining useful service life for Canada in recent years. However, railway lines, communication networks, and electric power infrastructure showed increases from 2009 to 2017.
Infrastructure investment contribution to gross domestic product decreases slightly
The investment in infrastructure assets can make a significant contribution to Canada's economy as the impact of these often large projects has a ripple effect throughout many industries. Investment in a bridge not only contributes to the output of the construction industry, but also to output in the cement industry, the sand and gravel industry, and a host of service industries. In 2017, total investment in infrastructure assets was $78.5 billion. The direct and indirect economic contribution from this investment was $59.6 billion, a slight decrease from $60.0 billion in 2016.
In terms of jobs, this investment generated approximately 547,000 jobs in 2017 and around 545,000 jobs in 2016. Six provinces and Yukon had more jobs generated from infrastructure investment in 2017 than in 2016. For Canada, 54% of the total jobs were the result of direct investment effects, whereas 46% were indirectly generated from spin-offs in other industries.
Note to readers
The Infrastructure Economic Account isolates the role and estimates the impact of infrastructure on Canada, the provinces and territories. Infrastructure assets are the physical structures and systems that support the production of goods and services, and their delivery to and consumption by governments, businesses and citizens. Data from the Infrastructure Economic Account are available for 2009 to 2017.
Unless otherwise noted, estimates of stock are presented on a net basis (net of depreciation).
Products
The Latest Developments in the Canadian Economic Accounts (13-605-X) is available.
The User Guide: Canadian System of Macroeconomic Accounts (13-606-G) is available.
The Methodological Guide: Canadian System of Macroeconomic Accounts (13-607-X) is available.
The product Infrastructure Economic Account – Data tables (36260002) is available. This product provides the data tables on infrastructure.
Contact information
For more information, or to enquire about the concepts, methods or data quality of this release, contact us (toll-free 1-800-263-1136; 514-283-8300; STATCAN.infostats-infostats.STATCAN@canada.ca) or Media Relations (613-951-4636; STATCAN.mediahotline-ligneinfomedias.STATCAN@canada.ca).
- Date modified:


