Foreign direct investment, 2017
Archived Content
Information identified as archived is provided for reference, research or recordkeeping purposes. It is not subject to the Government of Canada Web Standards and has not been altered or updated since it was archived. Please "contact us" to request a format other than those available.
Released: 2018-04-25
The stock of Canadian direct investment abroad rose 3.4% to $1,121.1 billion in 2017 as increased investment activity in Europe and North America was partially offset by the downward revaluation effect of a stronger Canadian dollar against the US dollar.
The stock of foreign direct investment in Canada increased 1.9% to $824.0 billion, mostly reflecting funds invested by foreign direct investors in existing affiliates.
As a result, Canada's net direct investment position with the rest of the world widened by $22.1 billion in 2017 to $297.1 billion. Over the previous 10 years, the stock of Canadian direct investment abroad grew by 117.6%—nearly double the rate of foreign direct investment in Canada.
Canadian direct investment increases in Europe and North America
The increase in the value of Canadian direct investment abroad in 2017 was mainly due to higher investment positions in Europe (+7.7%) and North America (+1.9%). The higher positions in Europe were partly attributable to the upward revaluation effect of a lower Canadian dollar against the Euro (-6.2%) and British pound (-2.4%). In North America, the appreciation of the Canadian dollar against the US dollar (+6.6%) offset some of the growth in investment into that region.
The stock of Canadian direct investment in the United States continued to rise in 2017, up 4.9% to $504.8 billion. The US share of overall Canadian direct investment abroad rose to 45.0% by the end of 2017, its highest level since 2008 but still well below the peak levels of the early 1990s.
In Europe, the stock of Canadian direct investment increased 7.7% to $288.4 billion following a small decline in 2016. The increase was mostly due to higher investment in the United Kingdom, Luxembourg and Netherlands. The stock of direct investment also increased in Asia and Oceania (+4.9%) and Africa (+3.7%). South America was the sole region to post a decrease in the stock of direct investment (-1.0%).
Foreign direct investment in Canada up on higher holdings from North America and Asia/Oceania
The increase in the stock of foreign direct investment in Canada in 2017 was driven by higher investment from North America (+4.6%) and Asia/Oceania (+6.5%).
The United States was responsible for most of the increase from North America, rising 4.2% to $404.5 billion. China led the increase in Asia/Oceania, up 7.5% to $16.4 billion. Meanwhile, holdings from Europe fell 2.6% to $288.9 billion. Declines from Netherlands (-5.4%) and Switzerland (-8.8%) overshadowed gains from the United Kingdom (+7.3%).
On an instrument basis, the foreign direct investment position in Canada, in the form of equity, grew 3.6% to $684.9 billion in 2017, while the position in the form of debt instruments declined 5.9% to $139.1 billion. Equity accounted for 83.1% of the stock of foreign direct investment in Canada, compared with 93.2% for the stock of Canadian direct investment abroad.
Increase in Canadian direct investment abroad concentrated in the transportation and warehousing industry
On an industry basis, Canadian direct investment abroad in the transportation and warehousing industry rose 43.6% on strong merger and acquisition activity in the United States.
Other significant increases in the stock of Canadian investment abroad in 2017 were seen in finance and insurance (+3.0%), and management of companies and enterprises (+5.1). These increases were partially offset by declines in the mining and oil and gas extraction (-5.2%) and manufacturing (-4.1%) industries.
The finance and insurance industry remained the primary destination for Canadian direct investment abroad at the end of 2017, with a 35.3% share of the total position, down from the peak of 39.6% reached in 2012.
Foreign direct investment in Canada up most in wholesale trade and finance and insurance industries, while largest decline is in oil and gas extraction
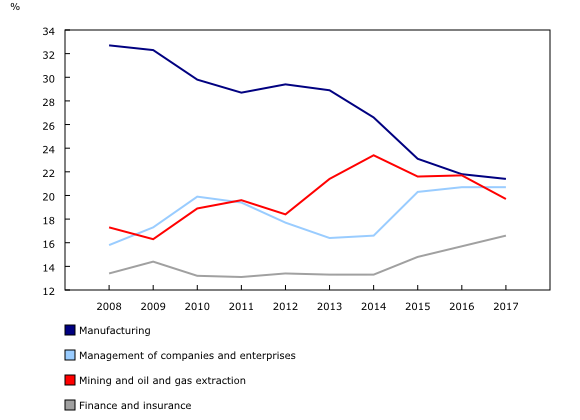
The growth in the value of foreign direct investment in Canada in 2017 was concentrated in the wholesale trade industry, up 8.6% to $74.7 billion, followed by an 8.0% increase in the finance and insurance industry to $137.0 billion. The stock of investment in oil and gas extraction dropped 7.4% to $ 162.2 billion, as direct investors from abroad sold some of their assets back to Canadian investors. Manufacturing declined 0.3%, mainly on a 15.8% reduction in the petroleum and coal products manufacturing industry. Despite the decrease, manufacturing remained the top industry for foreign direct investment in Canada, with a 21.4% share at the end of 2017.
Although it remains the largest industry for foreign direct investment in Canada, foreign investment in the manufacturing industry has not kept pace with overall investment trends over the past decade, with that industry's share down significantly from the 32.7% share it held in 2008. During the same period, the shares of management of companies and enterprises, finance and insurance and mining and oil and gas extraction have all increased. In the case of the management of companies and enterprises industry, some of these companies may also have activities that are tied to other industries such as manufacturing and mining and oil and gas extraction.
Foreign direct investment by ultimate investor, 2016
Measuring foreign direct investment in Canada on an ultimate investor basis, which looks through the country of the immediate direct investor to show the country that ultimately controls the investment in Canada, can result in substantial changes in the distribution of inward positions by country.
The difference between the immediate and ultimate investor concepts can be best illustrated with an example. Assume a firm in the United States wants to acquire a Canadian mining company for $1 billion. The US firm has a holding company in the Netherlands and chooses to route the $1 billion through the holding company. The immediate investing country is the Netherlands, while the ultimate investing country is the United States.
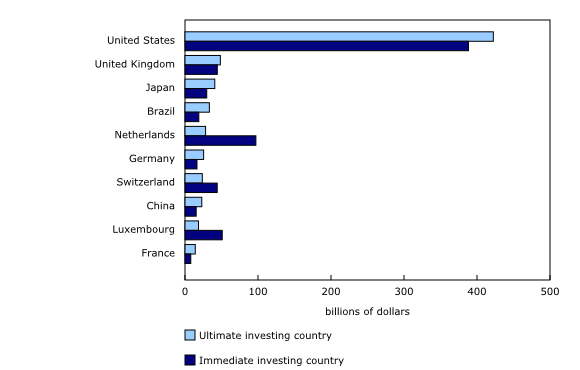
The United States, which is already the dominant direct investor in Canada on an immediate investor basis, further increases its share of overall investment when the data is presented on an ultimate investor basis. The stock of direct investment in Canada held by US investors in 2016 (the latest year for which information on an ultimate investor basis is available) increased from $388.3 billion on an immediate basis to $422.4 billion on an ultimate basis, a difference of 8.8%. The United States accounted for 52.2% of total foreign direct investment in Canada on an ultimate basis in 2016, compared with 48.0% on an immediate basis.
Other countries with notable increases in investment when measured on an ultimate investor basis include the United Kingdom, Brazil, China and Japan. On the other hand, moving to foreign direct investment on an ultimate investor basis results in a substantial reallocation of direct investment out of countries such as Luxembourg, the Netherlands and Switzerland. When measured on an ultimate investor basis, there is a 33.4% reduction in the stock of direct investment held by investors in Europe, which indicates that investors in other parts of the world often channel their investments into Canada through European countries.
When measured on an ultimate investor basis, there is also a very small proportion of foreign direct investment that ultimately comes from Canadian sources (known as "round-tripping" investment). In 2016, the value of this "round-tripping" amounted to $8.6 billion, which was equal to around 1% of total foreign direct investment into Canada. In other countries such as the United States, Germany and France, for which information on an ultimate investor basis is available, round-tripping typically accounts for a higher percentage of overall investment.
Note to readers
This is the annual release of detailed foreign direct investment data at book value. This release contains country and industry details for foreign direct investment that are drawn from the annual survey. This detailed information is not available at the time of quarterly international investment position releases. However, aggregates of direct investment positions, both at book and market values, are available as part of the quarterly international investment position release. The current aggregates at book value, along with revised aggregates at market value, will be integrated into the international investment position at the time of the third quarter 2018 release in December, in line with the Canadian System of Macroeconomic Accounts revision policy.
Direct investment is a component of the international investment position that refers to the investment of an entity in one country (the direct investor) obtaining a lasting interest in an entity in another country (the direct investment enterprise). The lasting interest implies the existence of a long-term relationship between the direct investor and the direct investment enterprise and a significant degree of influence by the direct investor on the management of the direct investment enterprise.
In practice, direct investment is deemed to occur when a direct investor owns at least 10% of the voting equity in a direct investment enterprise. This report presents the cumulative year-end positions for direct investment, measured as the total value of equity and the net value of debt instruments between direct investors and their direct investment enterprises.
Foreign direct investment by country and by industry
Following international standards, the main measure of direct investment is based on the country of residence of the direct investor (immediate parent company) for foreign direct investment in Canada and on the country of residence of the direct investment enterprise (the immediate subsidiary) for Canadian direct investment abroad. This implies that direct investment is largely attributed to the first investor/investee country, rather than the ultimate investor/investee country. Direct investment data on an immediate investor basis is available in CANSIM tables 376-0051 and 376-0052.
Foreign direct investment in Canada by ultimate investor
A new supplementary series on inward foreign direct investment in Canada by ultimate investor is now available in CANSIM table 376-0251. This new series differs from the standard presentation of foreign direct investment, which is based on the country of residence of the immediate direct investor, by showing the country of the investor that ultimately controls the investment in Canada. Because inward foreign direct investment may be channeled through holding companies or other legal entities in intermediate countries before reaching Canada, the measurement of foreign direct investment on an ultimate investor basis can result in substantial changes in the distribution of inward positions by country when compared to foreign direct investment measured on an immediate investor basis. The new series will initially cover the reference years 2014 to 2016, with additional years to be added with subsequent releases.
Currency valuation
The value of Canadian direct investment abroad is denominated in foreign currency and converted to Canadian dollars at the end of each period for which a year-end position is calculated. When the Canadian dollar is depreciating in value, the restatement of the value of direct investment abroad in Canadian dollars increases the recorded value. The opposite is true when the dollar is appreciating. Foreign direct investment in Canada is directly recorded in Canadian dollars and the fluctuation of the Canadian dollar has no impact on the recorded value.
Data quality
In general, data for smaller countries and industries (defined as countries with foreign direct investment below $500 million or industries at the three-digit level of the North American Industry Classification System) are subject to higher sampling variability.
Contact information
For more information, contact us (toll-free 1-800-263-1136; 514-283-8300; STATCAN.infostats-infostats.STATCAN@canada.ca).
To enquire about the concepts, methods or data quality of this release, contact Marc Atkins (613-790-7339; marc.atkins@canada.ca), International Accounts and Trade Division.
- Date modified:


